Fig. 3.
Download original image
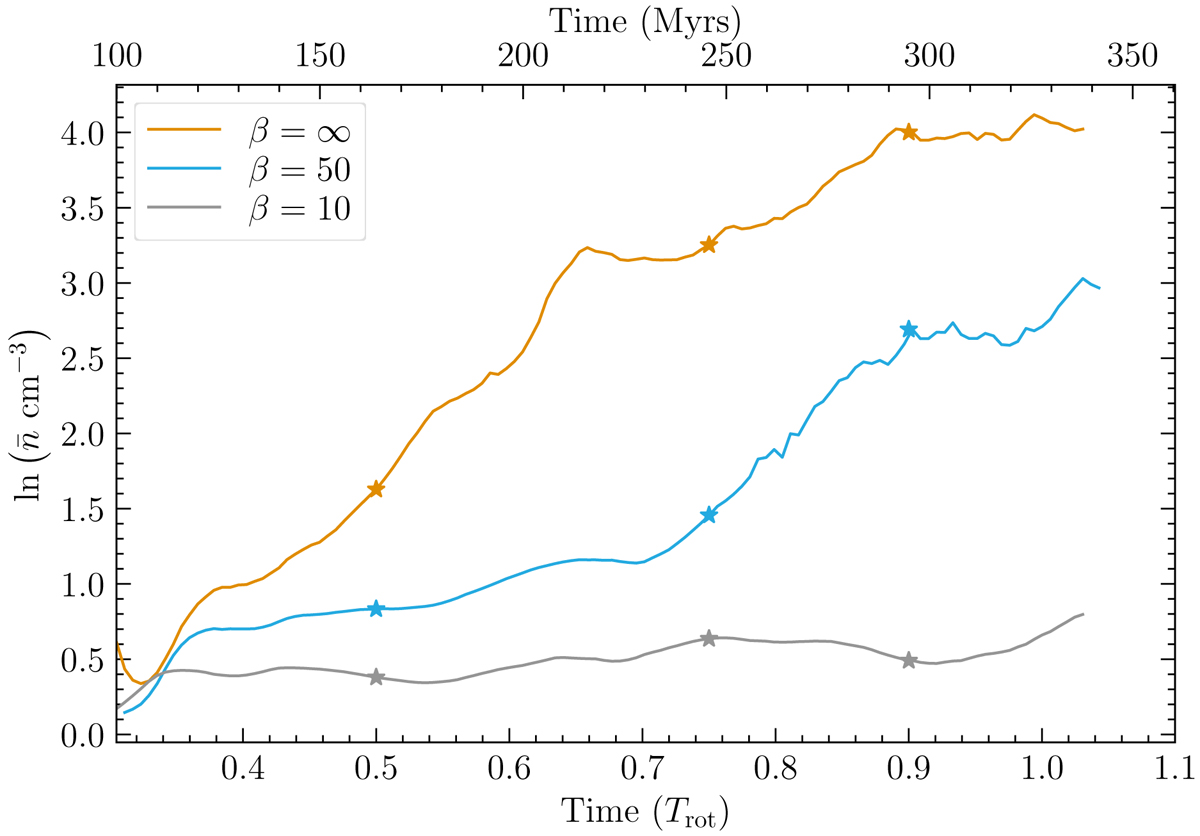
Time evolution of the mass-weighted mean density (![]() ) of all the cells with n ≥ 1 cm−3. The bottom abscissa shows the time normalised by the rotation period, and the top abscissa shows the absolute time. The stars mark the times at which we show the disc morphology in the Fig. 1. The β = 10 case lacks appreciable mass above the threshold density of 1 cm−3, as opposed to the other two cases. After t = 0.75 Trot, the mean density of the β = 10 run decreases slightly as the spiral arms diffuse, while it rises in the other two cases as the arms fragment into denser clouds.
) of all the cells with n ≥ 1 cm−3. The bottom abscissa shows the time normalised by the rotation period, and the top abscissa shows the absolute time. The stars mark the times at which we show the disc morphology in the Fig. 1. The β = 10 case lacks appreciable mass above the threshold density of 1 cm−3, as opposed to the other two cases. After t = 0.75 Trot, the mean density of the β = 10 run decreases slightly as the spiral arms diffuse, while it rises in the other two cases as the arms fragment into denser clouds.
Current usage metrics show cumulative count of Article Views (full-text article views including HTML views, PDF and ePub downloads, according to the available data) and Abstracts Views on Vision4Press platform.
Data correspond to usage on the plateform after 2015. The current usage metrics is available 48-96 hours after online publication and is updated daily on week days.
Initial download of the metrics may take a while.