Fig. 4.
Download original image
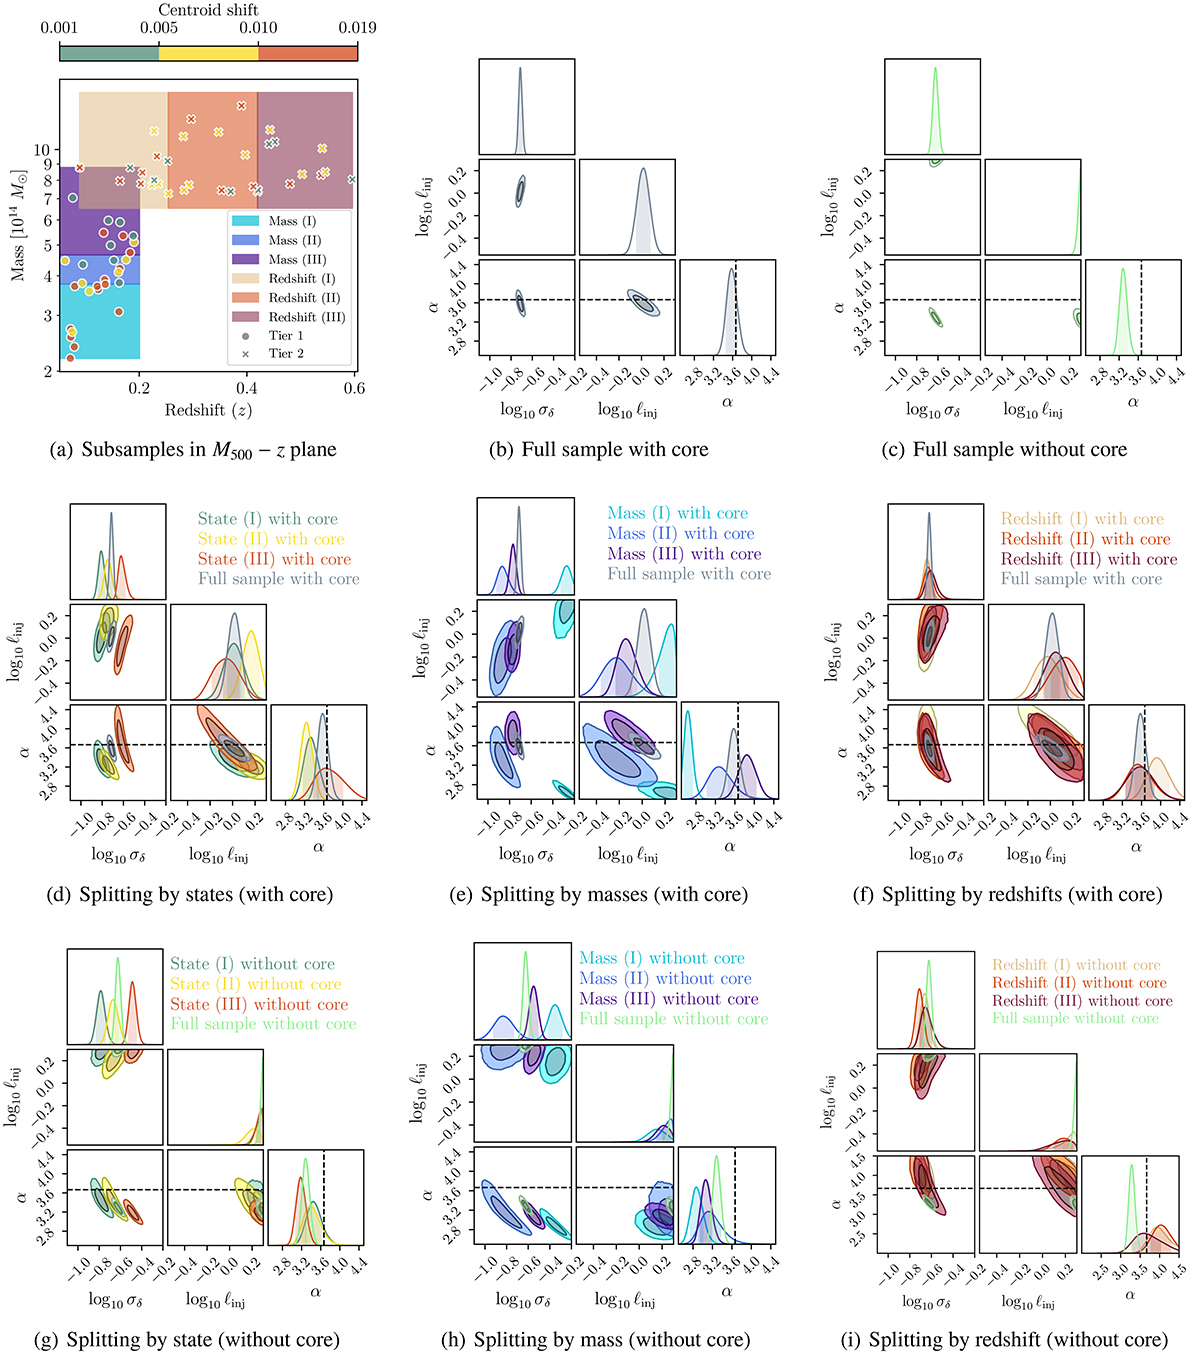
Constraints on the density fluctuation parameters in the state, mass, and redshift sub-samples used in this analysis. (a) Distribution of sub-samples in mass-redshift plane. The shaded areas indicate the mass and redshift sub-samples extracted from Tiers 1 and 2, respectively. The colour of the dots reflects the dynamical state of the clusters as measured by the centroid shift w. (b) Joint posterior distributions of the standard deviation, σδ, the injection scale, ℓinj, and the spectral index α of the density fluctuation power spectrum parameters, evaluated on the full sample including the core < 0.15 R500 region and (c) excluding the core region. The dashed black line represents the expected 11/3 index from Kolmogorov theory. (d), (e), and (f) are the same plot using the sub-samples associated with the state, mass, and redshift, respectively, as defined in Table 1, including the core region. (g), (h), and (i) use the same sub-samples without the core regions.
Current usage metrics show cumulative count of Article Views (full-text article views including HTML views, PDF and ePub downloads, according to the available data) and Abstracts Views on Vision4Press platform.
Data correspond to usage on the plateform after 2015. The current usage metrics is available 48-96 hours after online publication and is updated daily on week days.
Initial download of the metrics may take a while.