Fig. 3.
Download original image
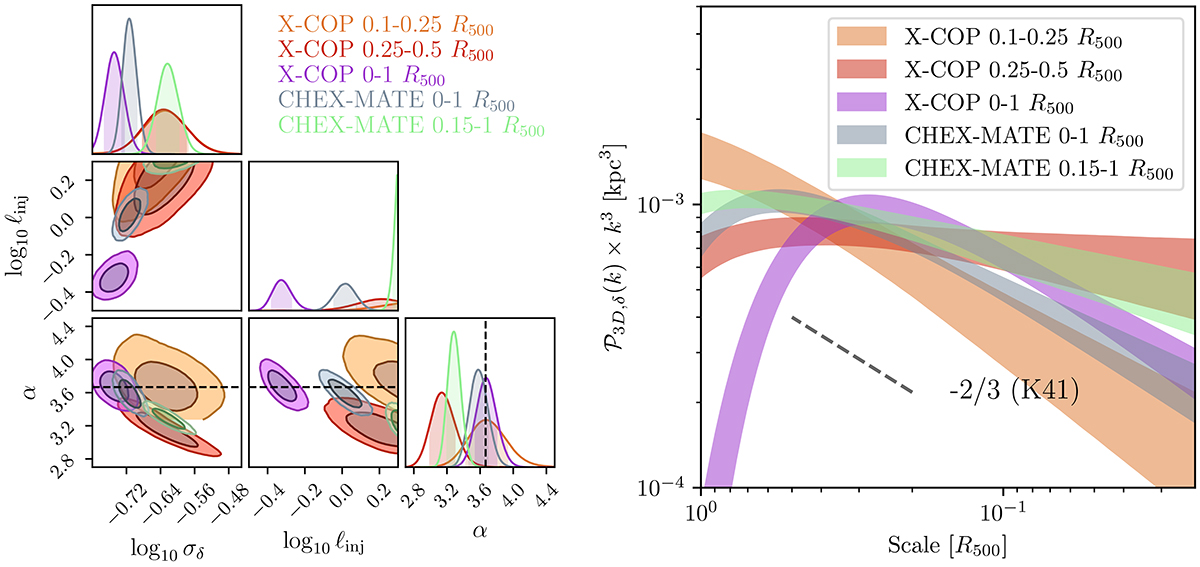
Density fluctuation parameters and associated 3D power spectra for the CHEX-MATE and X-COP cluster samples for various regions of interest. Left: Joint posterior distributions of standard deviation, σδ, injection scale, ℓinj, and spectral index, α, of density fluctuation power spectrum parameters, estimated on the cleaned CHEX-MATE sample and with the X-COP parameters in the 0.1–0.25 and 0.25–0.5 R500 rings, as computed in Dupourqué et al. (2023). The dashed black line represents the expected 11/3 index from Kolmogorov theory. Right: Associated 3D power spectra as defined from Eq. (1). The dashed slope indicates the expected slope from Kolmogorov. The scales are in units of R500.
Current usage metrics show cumulative count of Article Views (full-text article views including HTML views, PDF and ePub downloads, according to the available data) and Abstracts Views on Vision4Press platform.
Data correspond to usage on the plateform after 2015. The current usage metrics is available 48-96 hours after online publication and is updated daily on week days.
Initial download of the metrics may take a while.