Fig. 5.
Download original image
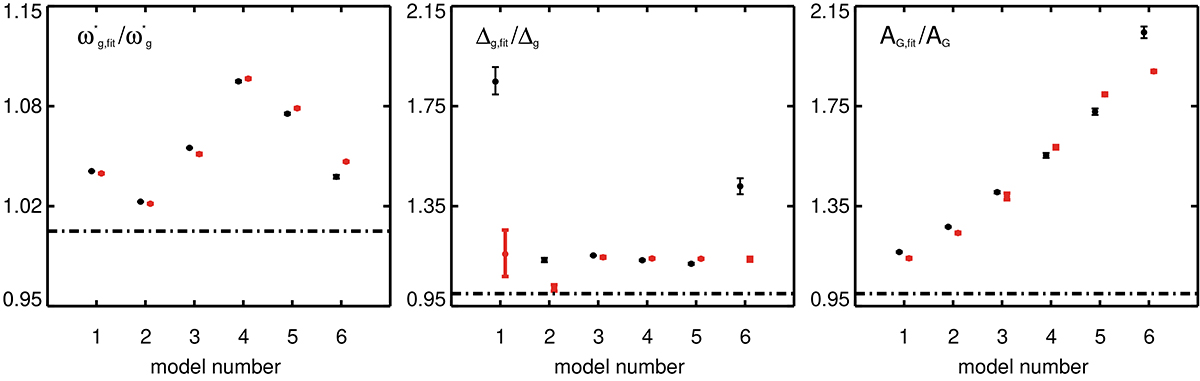
Ratios between the inferred and true glitch parameters. Buoyancy radius (left), glitch width (middle), glitch amplitude (right). A comparison is shown of the values inferred from the fits to the period spacings (black) and to the periods (red). Note that the symbols have been displaced horizontally for a better visualisation. The horizontal dashed-dotted black line represents a ratio equal to 1.
Current usage metrics show cumulative count of Article Views (full-text article views including HTML views, PDF and ePub downloads, according to the available data) and Abstracts Views on Vision4Press platform.
Data correspond to usage on the plateform after 2015. The current usage metrics is available 48-96 hours after online publication and is updated daily on week days.
Initial download of the metrics may take a while.