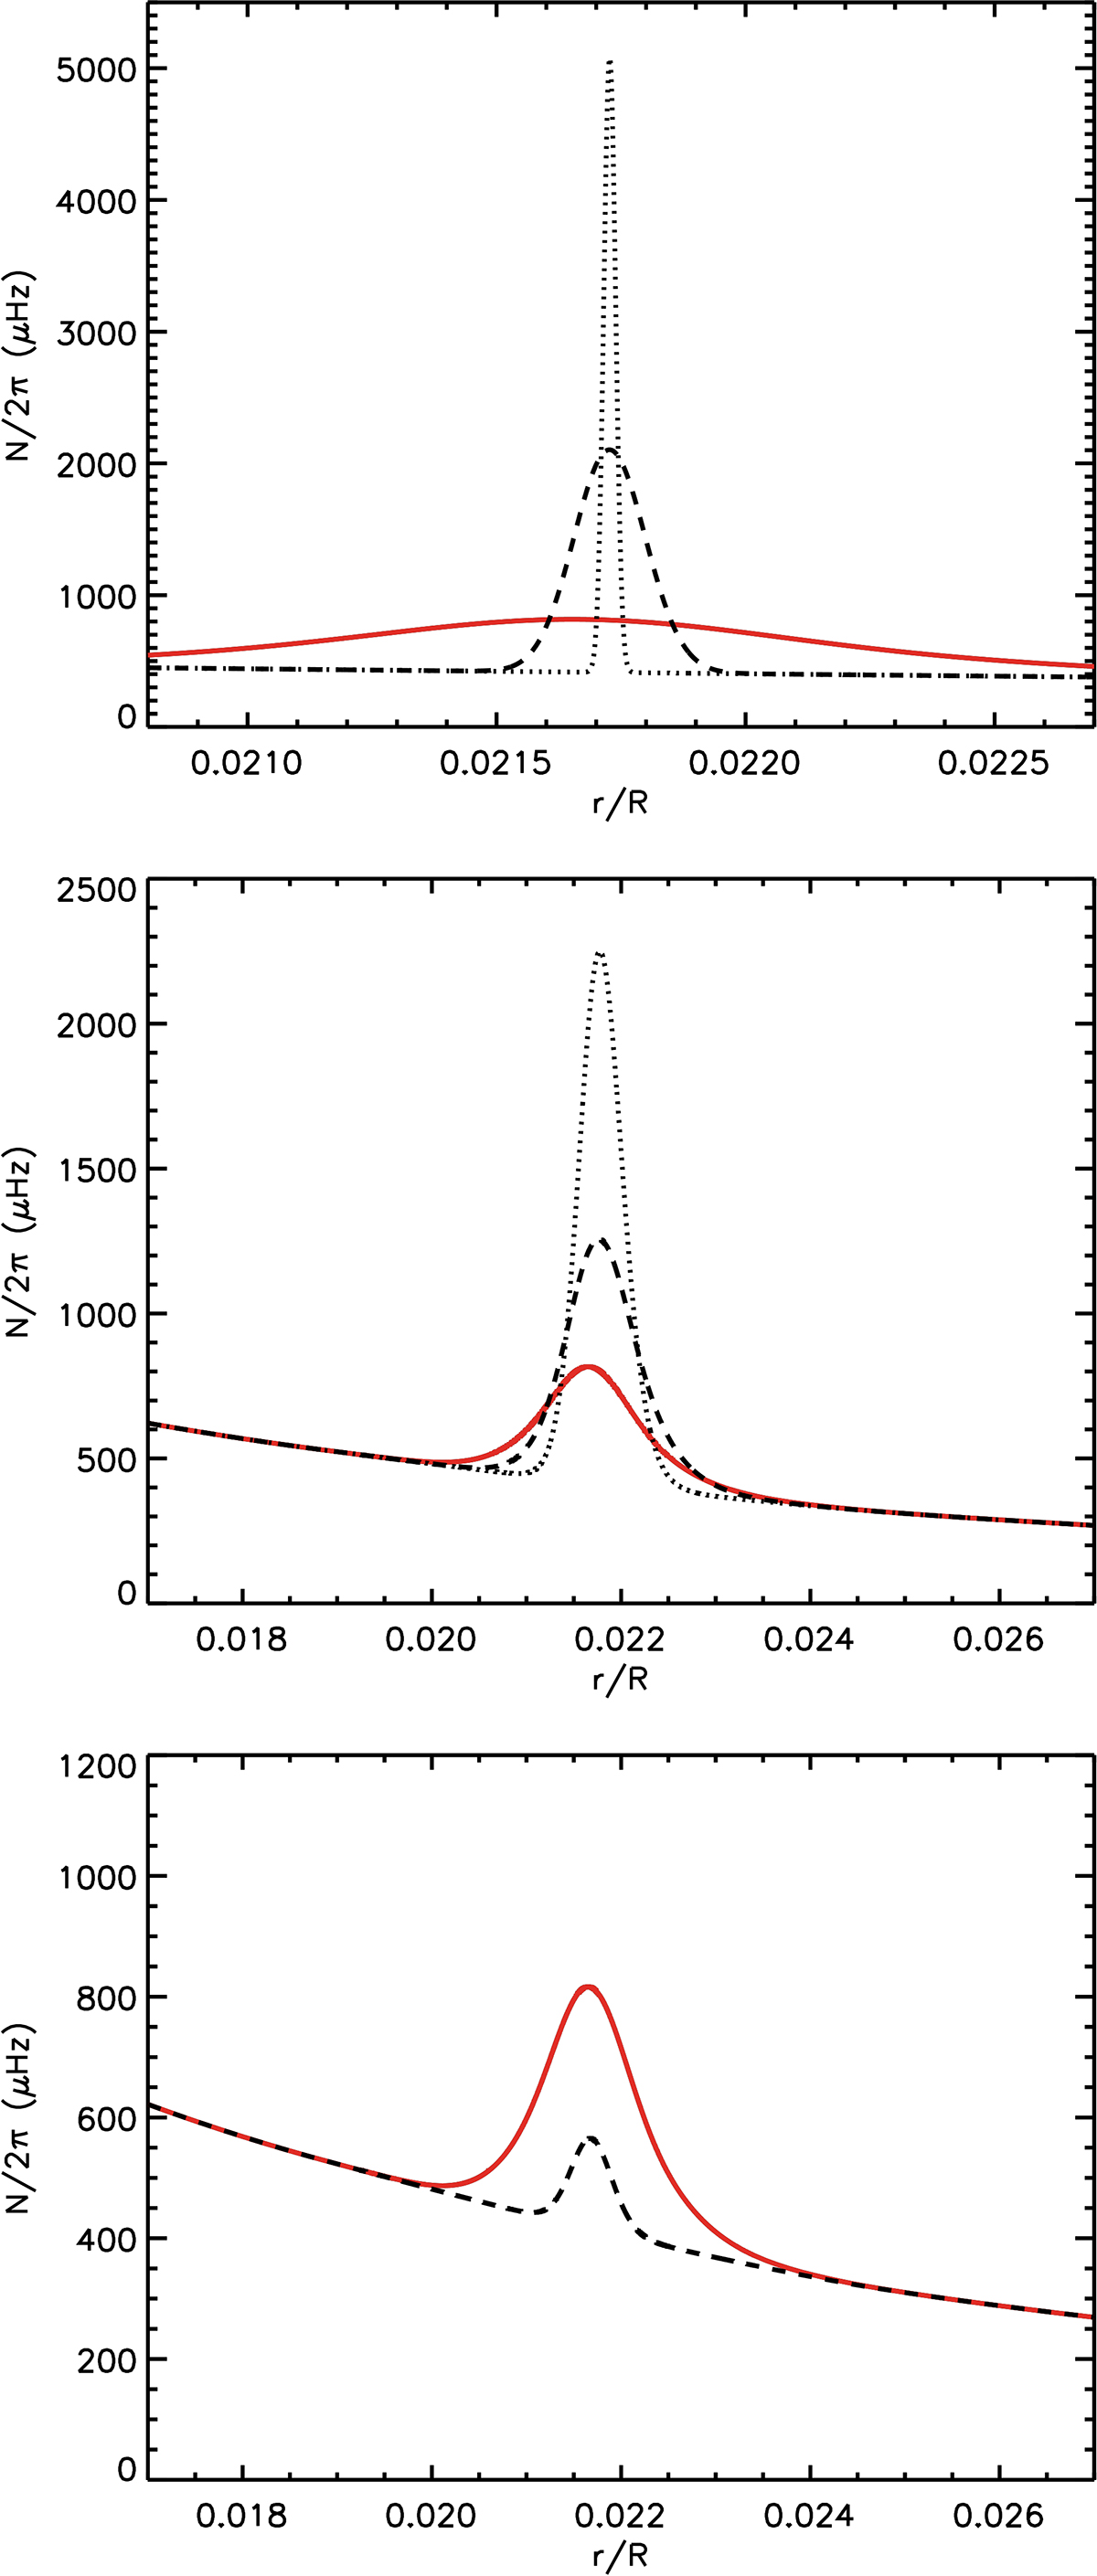
Fig. 3.
Download original image
Buoyancy frequency for the glitch-simulated models near the glitch position. In all panels, the continuous red line shows the case of model 5, corresponding to a glitch with properties similar to the original ASTEC model. Additionally, the black lines are as follows. Top panel: models 1 (dotted line) and 2 (dashed line). Middle panel: models 3 (dotted line) and 4 (dashed line). Bottom panel: model 6.
Current usage metrics show cumulative count of Article Views (full-text article views including HTML views, PDF and ePub downloads, according to the available data) and Abstracts Views on Vision4Press platform.
Data correspond to usage on the plateform after 2015. The current usage metrics is available 48-96 hours after online publication and is updated daily on week days.
Initial download of the metrics may take a while.