Fig. 1.
Download original image
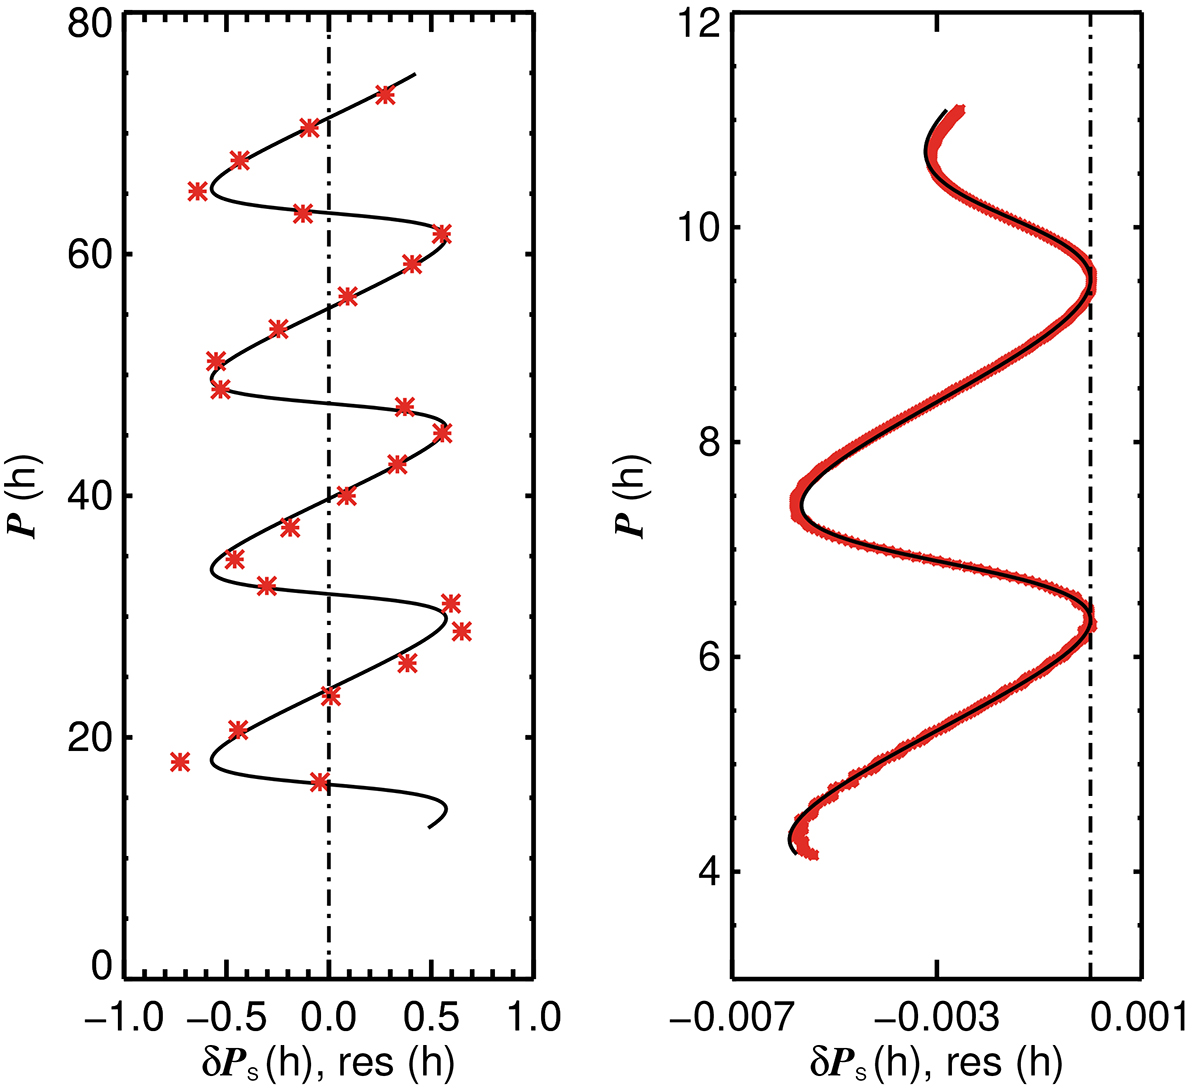
Period échelle diagrams representing the pulsations in the ASTEC models (red asteriscs) and the respective best fits derived from Eq. (10) (black lines). Left panel: main-sequence model and glitch phase given in Eq. (16). Right panel: RGB model and glitch phase given in Eq. (22). The vertical dashed-dotted black line marks res = 0.
Current usage metrics show cumulative count of Article Views (full-text article views including HTML views, PDF and ePub downloads, according to the available data) and Abstracts Views on Vision4Press platform.
Data correspond to usage on the plateform after 2015. The current usage metrics is available 48-96 hours after online publication and is updated daily on week days.
Initial download of the metrics may take a while.