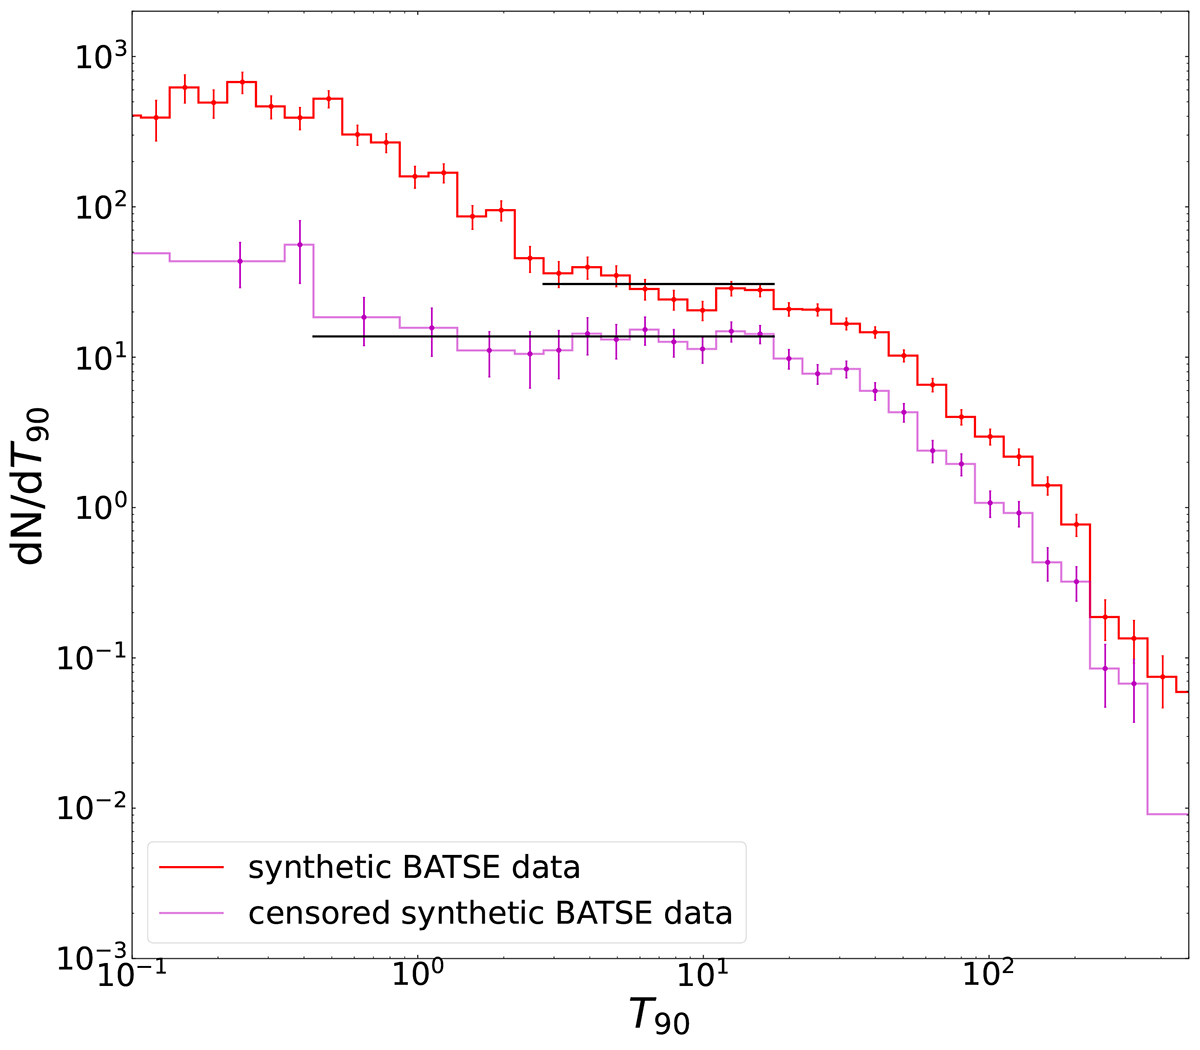
Fig. 5.
Download original image
Illustration of the impact of excluding SGRBs from the duration distribution on the observed plateau of LGRBs. The original plateau in the red histogram and the extension of it by removing SGRBs in the magenta histogram are purely statistical (resulting from the lognormal fits to data as depicted in Fig. 4a) and have no connections to the physics of GRBs or collapsars whatsoever.
Current usage metrics show cumulative count of Article Views (full-text article views including HTML views, PDF and ePub downloads, according to the available data) and Abstracts Views on Vision4Press platform.
Data correspond to usage on the plateform after 2015. The current usage metrics is available 48-96 hours after online publication and is updated daily on week days.
Initial download of the metrics may take a while.