Fig. 4.
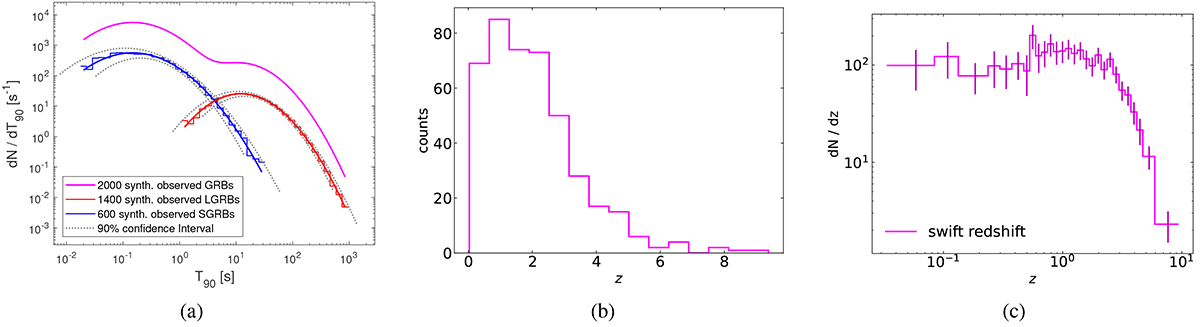
Download original image
BATSE-detectable samples of 600 SGRBs and 1400 LGRBs are randomly generated from our respective Monte Carlo Universes. (a) SGRBs, represented by the blue bins and LGRBs by the red bins, where each bin is the 50th percentile value of 10 000 synthetic detections. The solid blue and red lines are lognormal fits to the bins in the pre-transformed space. These two fits are summed to produce the solid magenta line multiplied by a factor of 10 to offset it for clarity. The dotted gray lines represent the 90% confidence interval for each binned distribution. (b) Distribution of observed Swift redshifts in linear space. (c) Redshift distribution transformed in the same manner as the duration distribution throughout this manuscript. After performing the transformation described in Bromberg et al. (2012), the resulting plot displays a plateau in the log–log space, although there is no apparent physical origin.
Current usage metrics show cumulative count of Article Views (full-text article views including HTML views, PDF and ePub downloads, according to the available data) and Abstracts Views on Vision4Press platform.
Data correspond to usage on the plateform after 2015. The current usage metrics is available 48-96 hours after online publication and is updated daily on week days.
Initial download of the metrics may take a while.