Fig. 3.
Download original image
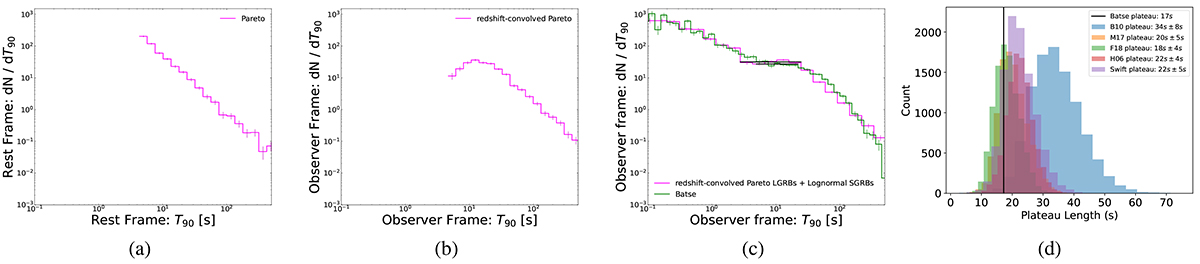
Illustration of the smoothing effects of convolution on the Pareto distribution, leading to the appearance of a plateau in ![]() plot. (a) Sampled points from a Pareto distribution after performing the bin merging as described in Bromberg et al. (2012). (b) Same data as in plot (a) but convolved with the redshift distribution of LGRBs (derived from Swift catalog). (c) Convolved observed duration distribution of LGRBs combined with a lognormal fit to the redshift distribution of SGRBs. For comparison, the green line represents the duration distribution of the BATSE SGRBs and LGRBs. The final observed plateau resulting from the Pareto distribution is 50% longer than the observed plateau in the duration distribution of BATSE LGRBs. (d) Distribution of the average plateau lengths, assuming an intrinsic Pareto duration distribution convolved with various GRB popular redshift distribution scenarios from the literature as listed in the plot legend. The observed plateau length in the BATSE duration data is illustrated by the vertical black line.
plot. (a) Sampled points from a Pareto distribution after performing the bin merging as described in Bromberg et al. (2012). (b) Same data as in plot (a) but convolved with the redshift distribution of LGRBs (derived from Swift catalog). (c) Convolved observed duration distribution of LGRBs combined with a lognormal fit to the redshift distribution of SGRBs. For comparison, the green line represents the duration distribution of the BATSE SGRBs and LGRBs. The final observed plateau resulting from the Pareto distribution is 50% longer than the observed plateau in the duration distribution of BATSE LGRBs. (d) Distribution of the average plateau lengths, assuming an intrinsic Pareto duration distribution convolved with various GRB popular redshift distribution scenarios from the literature as listed in the plot legend. The observed plateau length in the BATSE duration data is illustrated by the vertical black line.
Current usage metrics show cumulative count of Article Views (full-text article views including HTML views, PDF and ePub downloads, according to the available data) and Abstracts Views on Vision4Press platform.
Data correspond to usage on the plateform after 2015. The current usage metrics is available 48-96 hours after online publication and is updated daily on week days.
Initial download of the metrics may take a while.