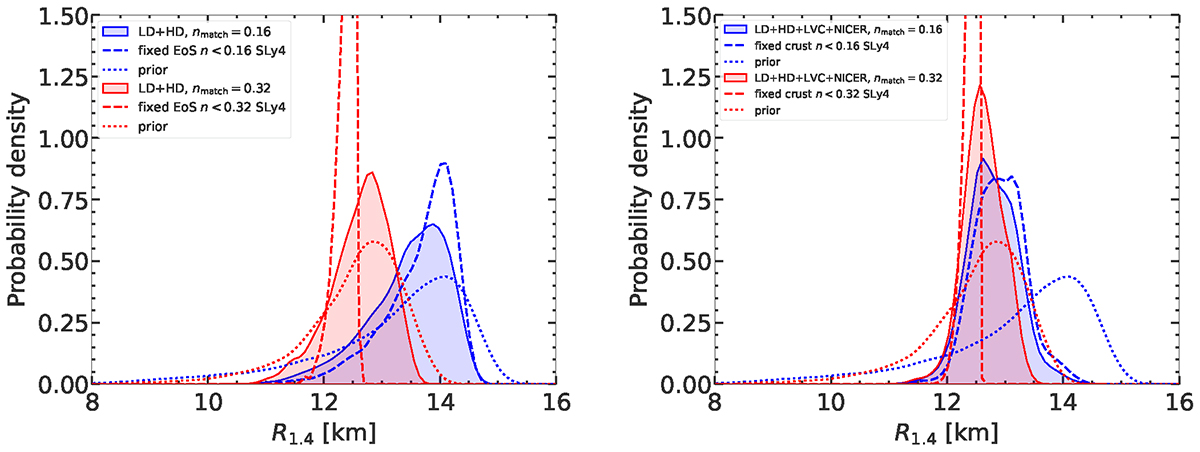
Fig. 6.
Download original image
Posterior distribution for radius of a 1.4 M⊙ NS. Left panel: blue (red) shaded area corresponds to posterior obtained by applying the low- and high-density (LD+HD) filters and matching the polytropes at 0.16 fm−3 (0.32 fm−3). The blue and red dashed curves are obtained by employing a unique EoS based on SLy4 until 0.16 fm−3 and 0.32 fm−3, respectively. For comparison, the corresponding priors are shown by dotted lines. Right panel: same as left panel, but the posterior is obtained by applying the low- and high-density filters combined with the constraints from GW170817 and NICER (LD+HD+LVC+NICER; see text for details).
Current usage metrics show cumulative count of Article Views (full-text article views including HTML views, PDF and ePub downloads, according to the available data) and Abstracts Views on Vision4Press platform.
Data correspond to usage on the plateform after 2015. The current usage metrics is available 48-96 hours after online publication and is updated daily on week days.
Initial download of the metrics may take a while.