Fig. 5.
Download original image
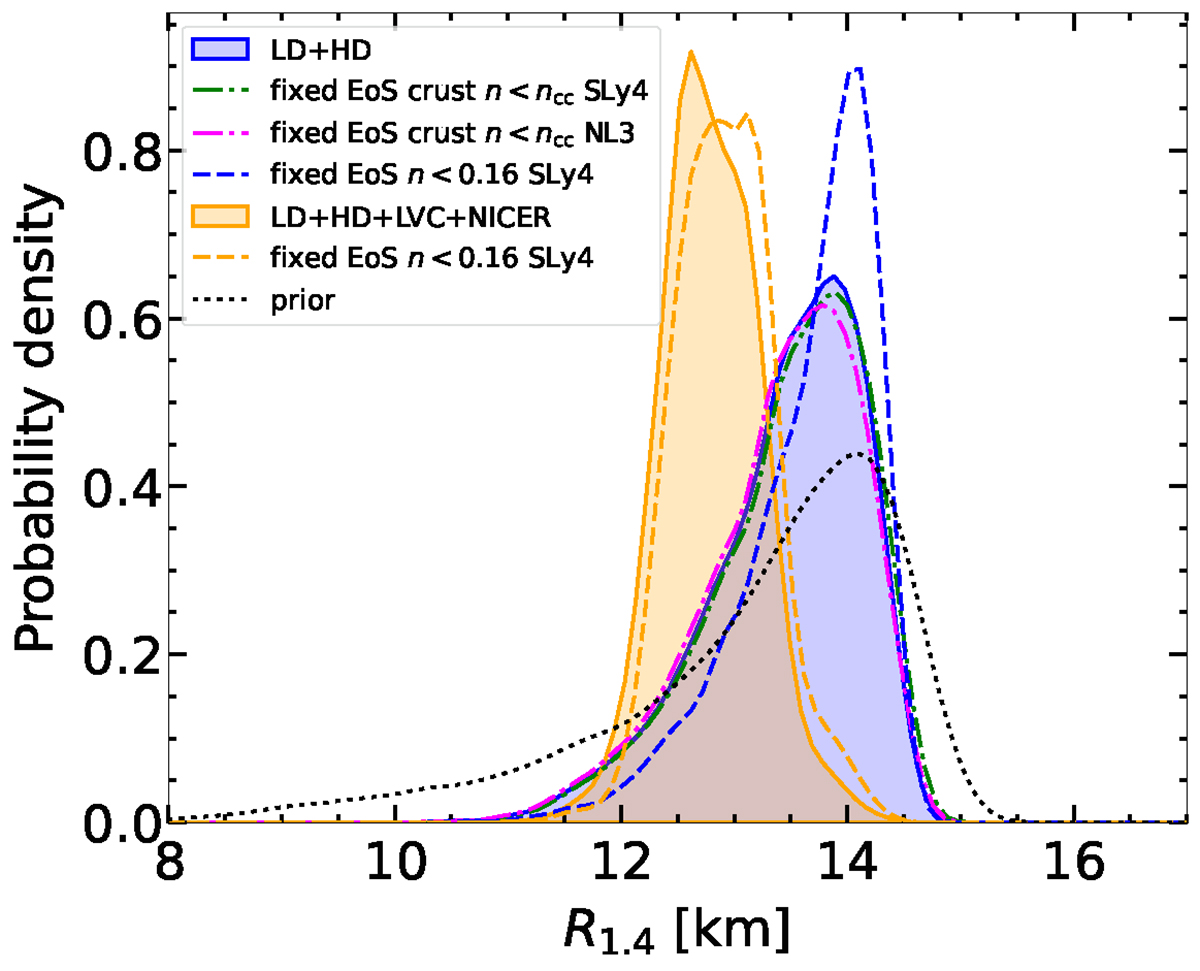
Posterior distribution for radius of a 1.4 M⊙ NS. The blue (orange) shaded area corresponds to the posterior obtained by applying the low- and high-density (LD+HD) filters (combined with the constraints from GW170817 and NICER). The blue and orange dashed curves are obtained by employing a unique EoS based on SLy4 until 0.16 fm−3, while the dash-dotted curves are obtained by employing the crust EoS based on SLy4 (green) and NL3 (magenta) until the crust–core transition. For comparison, the prior is shown by a dotted black line (see text for details).
Current usage metrics show cumulative count of Article Views (full-text article views including HTML views, PDF and ePub downloads, according to the available data) and Abstracts Views on Vision4Press platform.
Data correspond to usage on the plateform after 2015. The current usage metrics is available 48-96 hours after online publication and is updated daily on week days.
Initial download of the metrics may take a while.