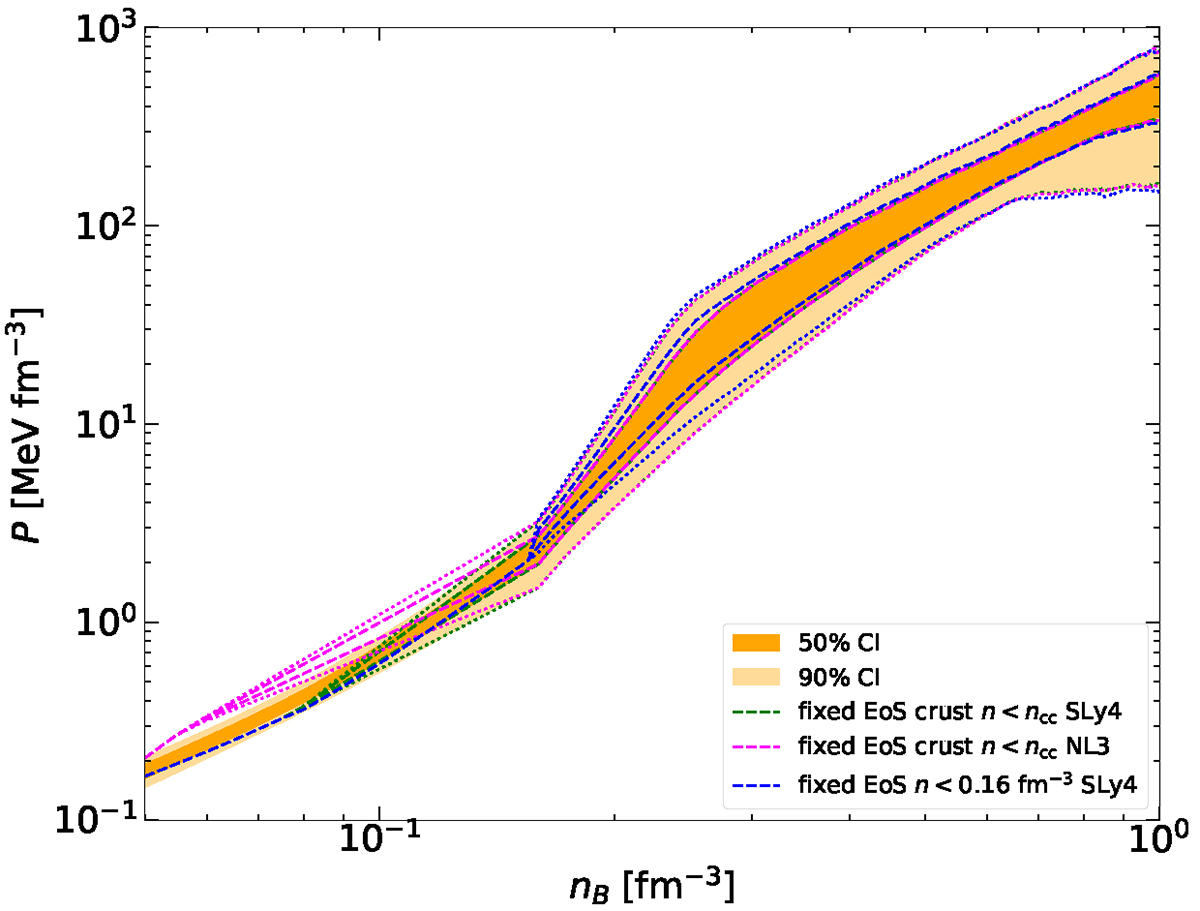
Fig. 3.
Download original image
Posterior distribution for EoS. Dark and light yellow bands correspond to the 50% and 90% confidence intervals for the EoS, respectively, obtained including the low- and high-density (LD+HD) filters. Green (magenta) curves indicate the 50% (dashed lines) and 90% (dotted lines) confidence intervals when the crust based on SLy4 (NL3) is used, while blue lines correspond to using the EoS model based on SLy4 until nmatch = 0.16 fm−3 (see text for details).
Current usage metrics show cumulative count of Article Views (full-text article views including HTML views, PDF and ePub downloads, according to the available data) and Abstracts Views on Vision4Press platform.
Data correspond to usage on the plateform after 2015. The current usage metrics is available 48-96 hours after online publication and is updated daily on week days.
Initial download of the metrics may take a while.