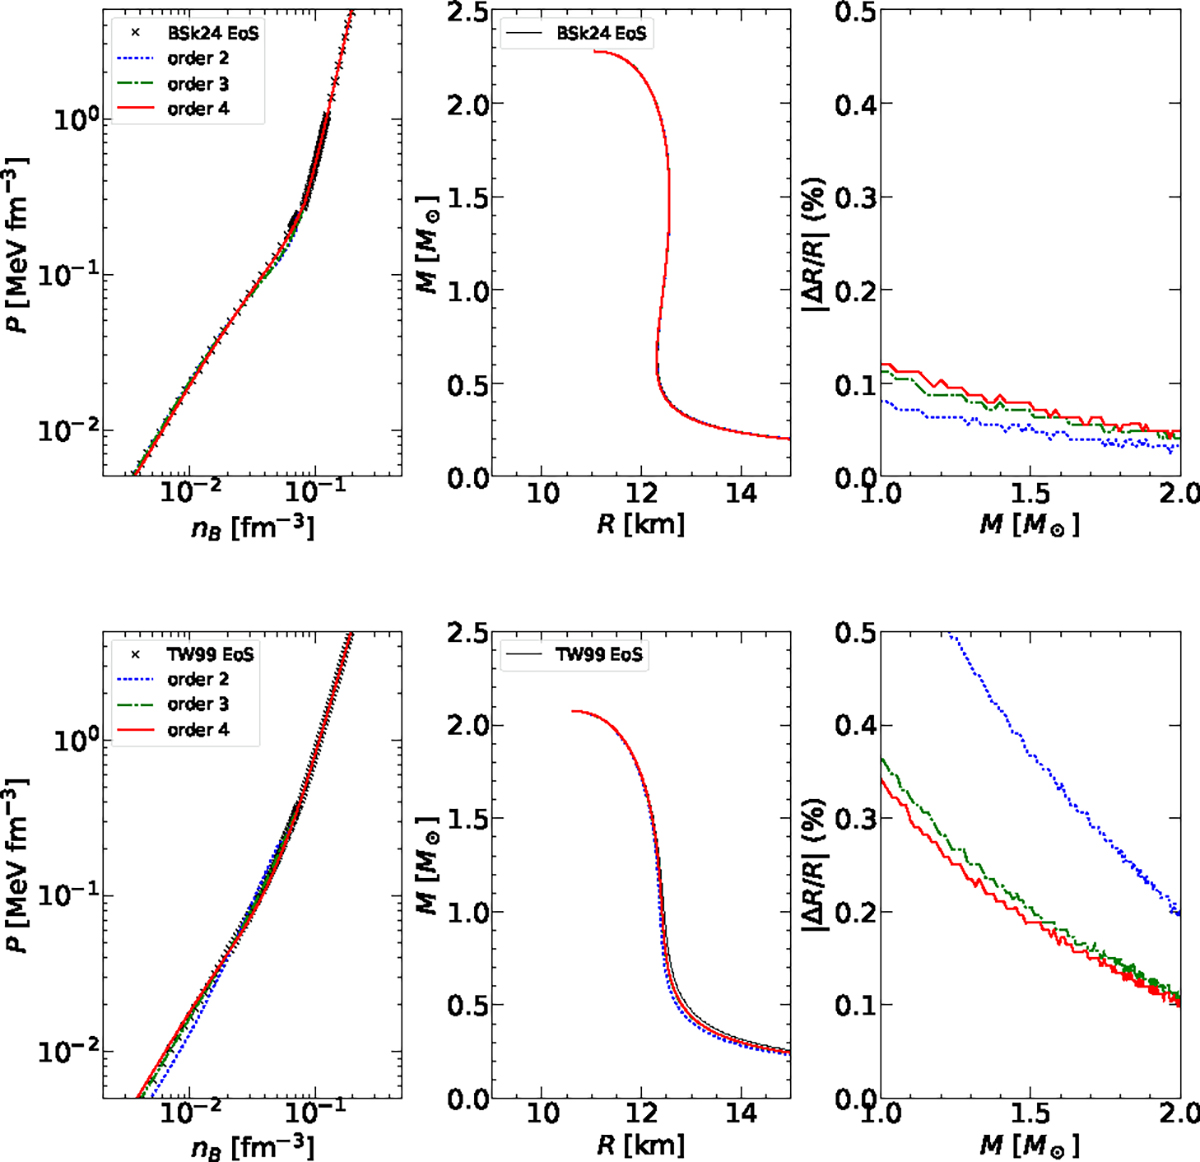
Fig. 2.
Download original image
Pressure versus baryon number density (left panels), mass-radius relation (middle panels), and absolute relative error on the radius (right panels) for different models. Crosses and solid black lines (left and middle panel, respectively) correspond to the original EoS, while dotted blue lines, dash-dotted green lines, and solid red lines correspond to the reconstruction at order 2, 3, and 4, respectively (see text for details).
Current usage metrics show cumulative count of Article Views (full-text article views including HTML views, PDF and ePub downloads, according to the available data) and Abstracts Views on Vision4Press platform.
Data correspond to usage on the plateform after 2015. The current usage metrics is available 48-96 hours after online publication and is updated daily on week days.
Initial download of the metrics may take a while.