Fig. 6
Download original image
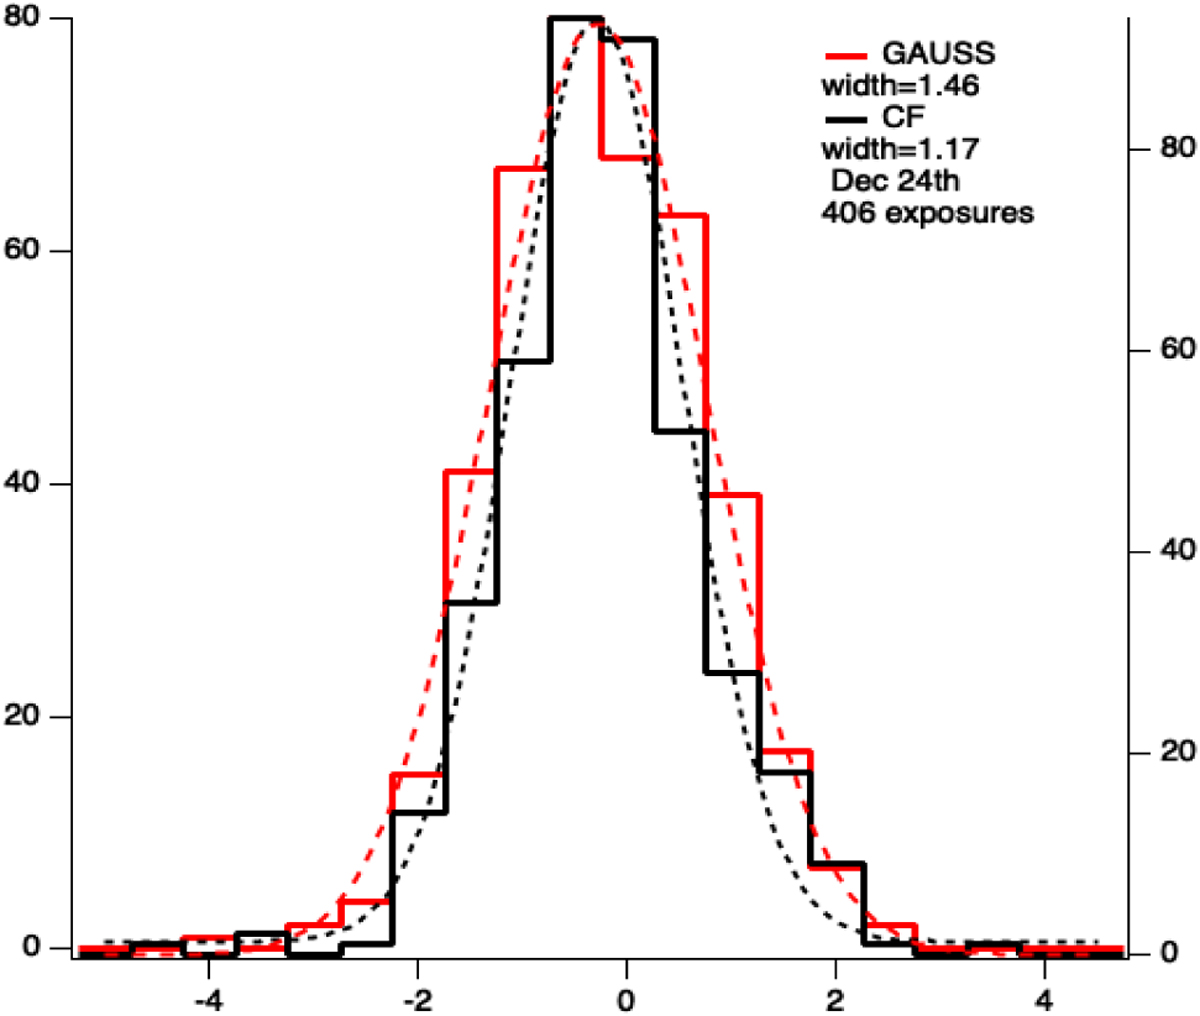
Histograms of RVs from the two different time series. They are obtained for the 406 exposures of night Dec24, after removal of linear fits to each series. The histogram is in red for the Gaussian fit and in black for EPiCA. Gaussian widths of histograms are indicated for each method. The EPiCA histogram is narrower than the Gaussian fit histogram.
Current usage metrics show cumulative count of Article Views (full-text article views including HTML views, PDF and ePub downloads, according to the available data) and Abstracts Views on Vision4Press platform.
Data correspond to usage on the plateform after 2015. The current usage metrics is available 48-96 hours after online publication and is updated daily on week days.
Initial download of the metrics may take a while.