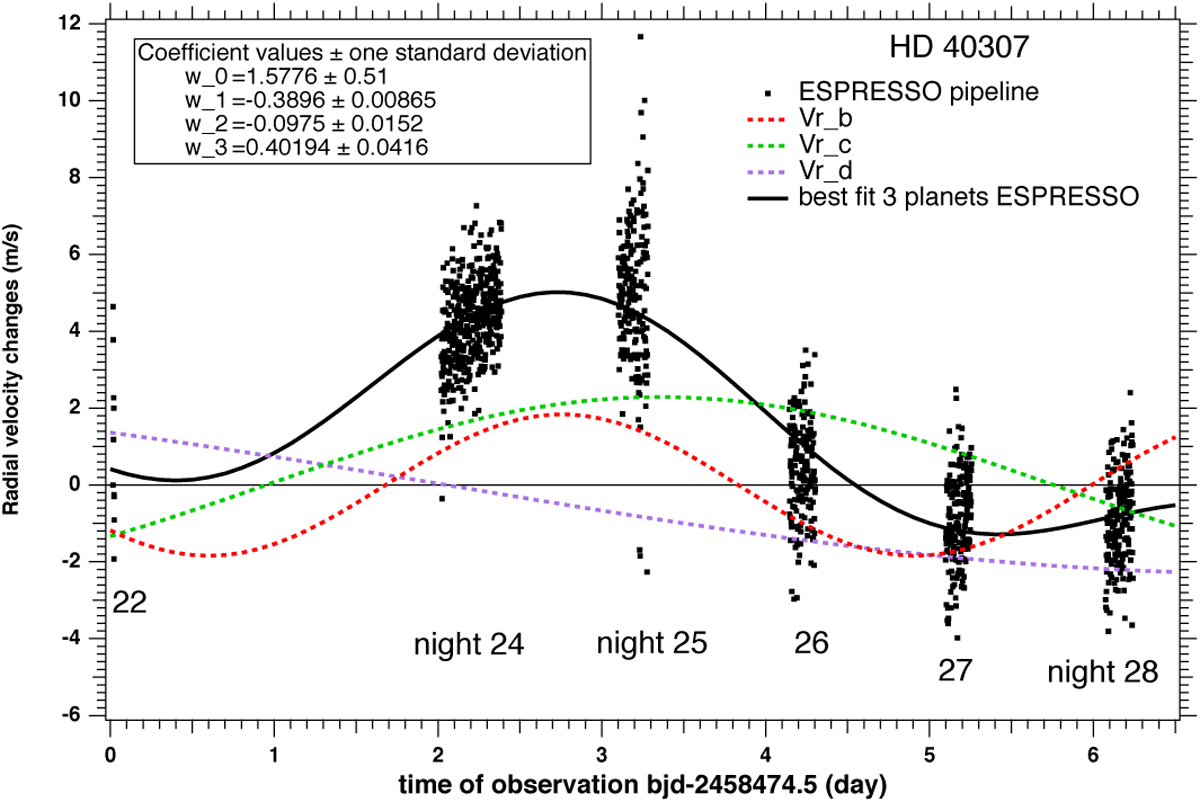
Fig. 5
Download original image
Same as Fig. 4, but with individual contributions of the planets. The three-planet best-fit curve is in black (solid line), while the dashed lines are each of the three sine waves representing the three planets: b (red), c (green), d (violet). The best-fit curve is the sum of the three planets plus a constant w0 = 1.5576 ± 0.515 m s−1.
Current usage metrics show cumulative count of Article Views (full-text article views including HTML views, PDF and ePub downloads, according to the available data) and Abstracts Views on Vision4Press platform.
Data correspond to usage on the plateform after 2015. The current usage metrics is available 48-96 hours after online publication and is updated daily on week days.
Initial download of the metrics may take a while.