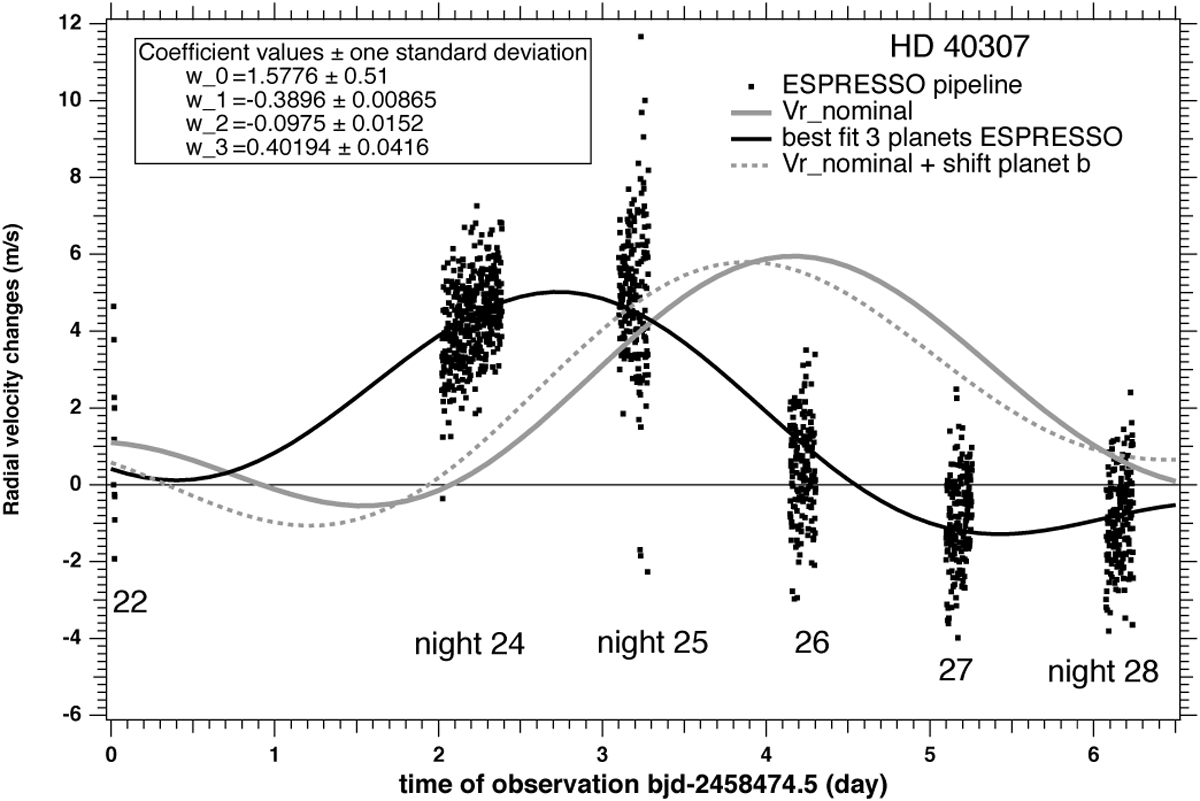
Fig. 4
Download original image
Comparison of pipeline RV time series with three-planets modeling. The black dots represent the time series of changes of RV values contained in the official pipeline, obtained by subtracting the RV value of the first exposure of the first night. The thick pale gray solid line is the extrapolation of the sum of the three sine waves as determined from 2008 HARPS data. It does not closely fit the data because the extrapolation over 9 yr is sensitive to small errors in the periods. The dashed gray lines is the same as the solid gray line, but with planet b period shorter by 0.0004 day, corresponding to twice the claimed error bar for the period of planet b. The solid black line is the best fit to the pipeline RV data by adjusting the phases of the three planets.
Current usage metrics show cumulative count of Article Views (full-text article views including HTML views, PDF and ePub downloads, according to the available data) and Abstracts Views on Vision4Press platform.
Data correspond to usage on the plateform after 2015. The current usage metrics is available 48-96 hours after online publication and is updated daily on week days.
Initial download of the metrics may take a while.