Fig. 3
Download original image
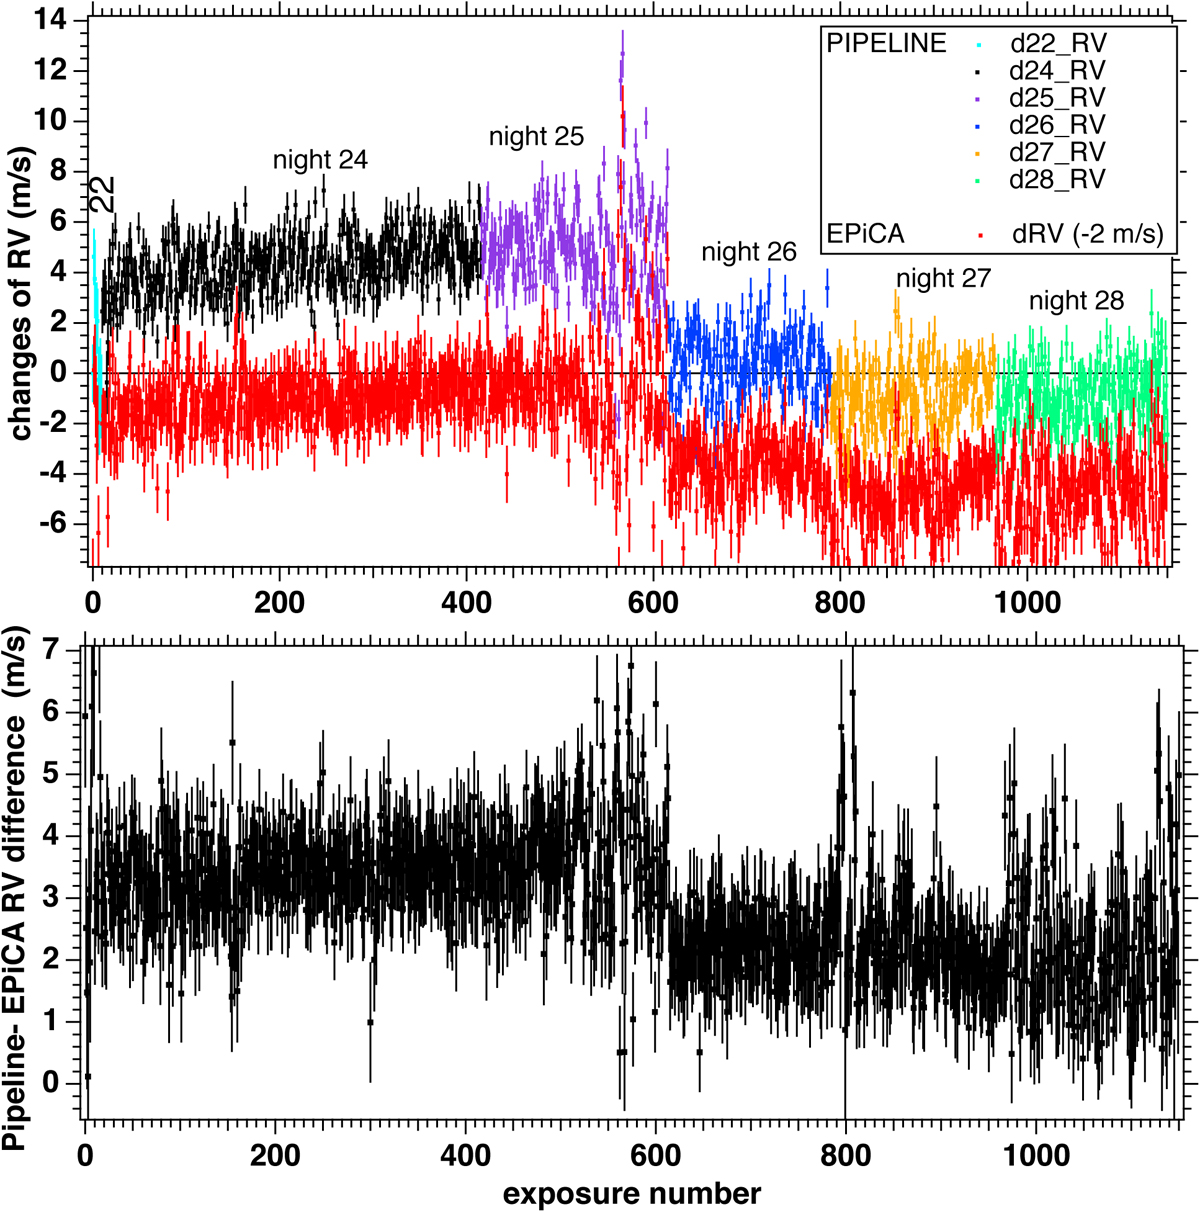
Two RV time-series and their difference. Top: comparison between the RVs derived from the Gaussian fit and the EPiCA method. The data (RV changes in m s−1) are plotted as a function of exposure number. The pipeline RVs are plotted with their error bars, in a different color for each night. They were derived by subtracting from all pipeline RV data contained in each spectrum fits file the value of the first exposure: 31.3668 km s−1. Red points are obtained by the EPiCA method applied to the CCFs of the current exposure and the first exposure of night 24 (exposure n°10 when all nights are concatenated), taken as a reference. A constant 2 m s−1 was subtracted for clarity. Bottom: differences between the two time series of RV changes: Gaussian fit – EPiCA (CF1 applied to CCFtot). This difference shows an abrupt decrease (~1.3 ms−1) after exposure no. 615, corresponding to the transition from night 25 to night 26, which remains after that.
Current usage metrics show cumulative count of Article Views (full-text article views including HTML views, PDF and ePub downloads, according to the available data) and Abstracts Views on Vision4Press platform.
Data correspond to usage on the plateform after 2015. The current usage metrics is available 48-96 hours after online publication and is updated daily on week days.
Initial download of the metrics may take a while.