Fig. 15
Download original image
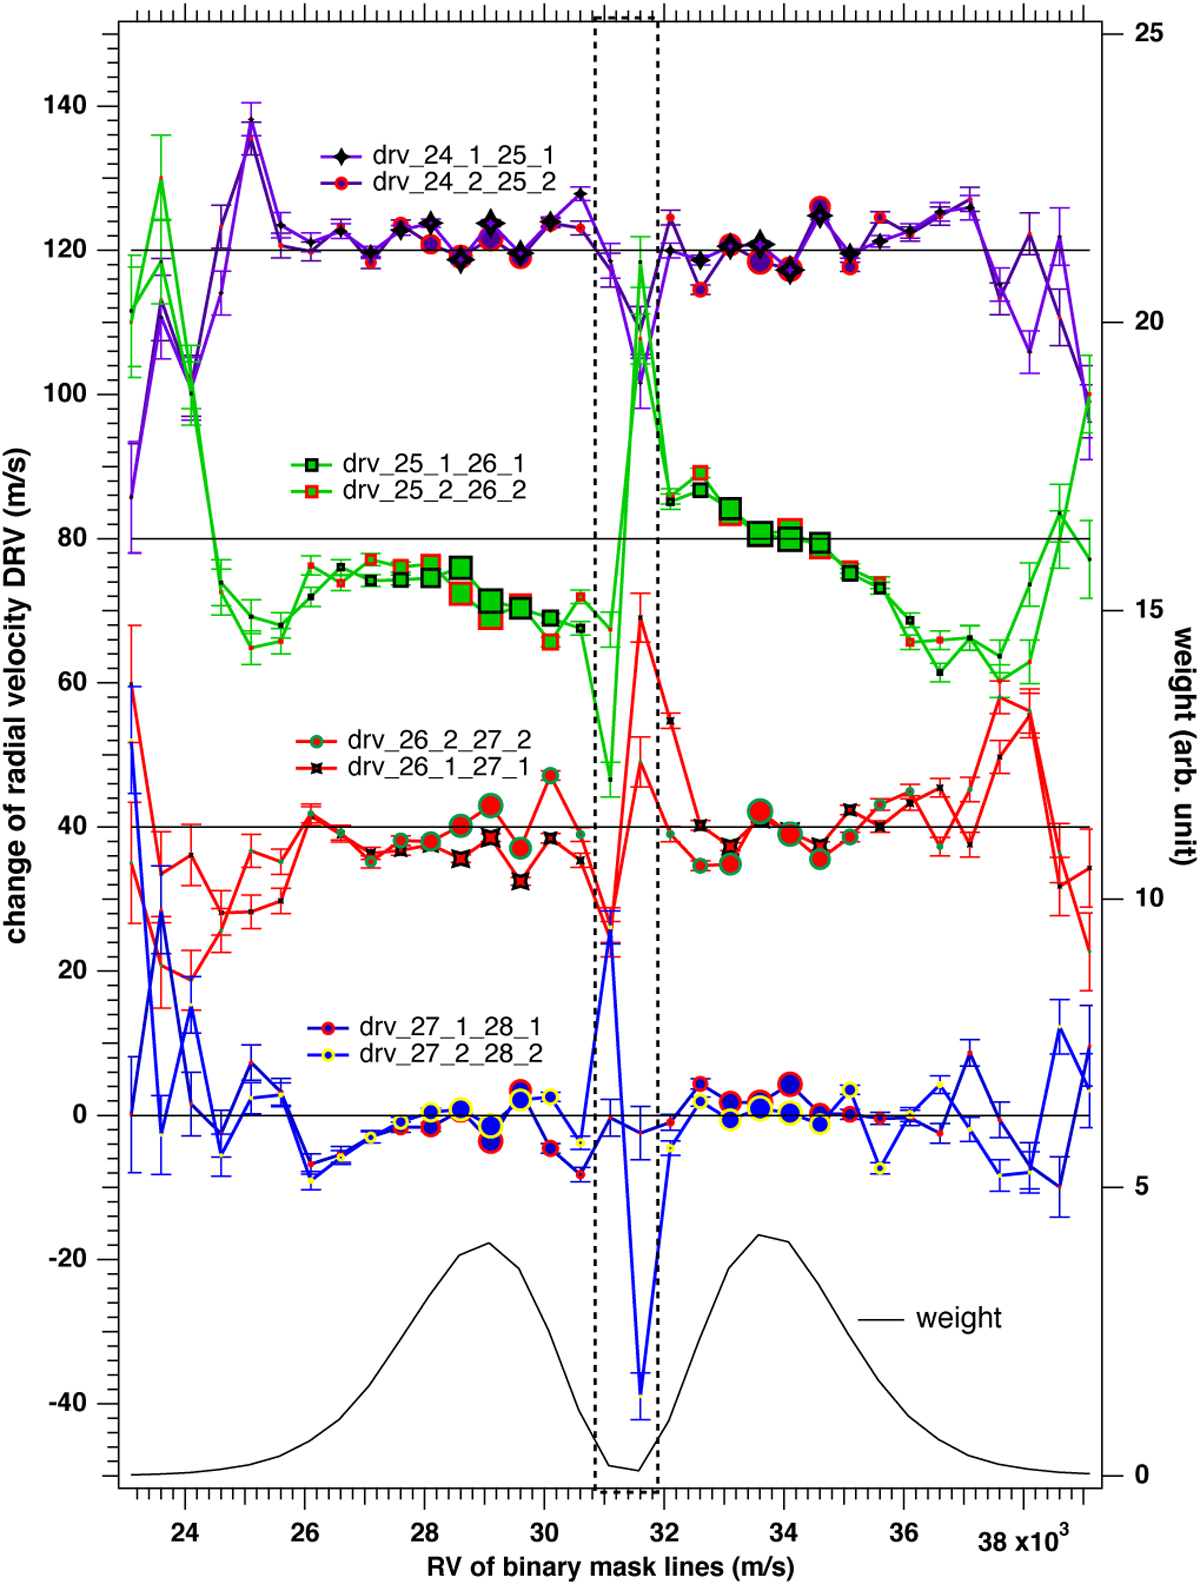
Same as Fig. 13, for four pairs of stacks that are one day apart over the five nights from night 24 to 28. Each pair consists of using either the first or the second parts of night. Offsets of 40 m s−1 are applied between two pairs of these EPiCA profiles. The actual zero value is indicated by a black thin line. The DRV curve for the pair 25–26 shows a different pattern in comparison with the other pairs, with a strong difference between the blue side and the red side.
Current usage metrics show cumulative count of Article Views (full-text article views including HTML views, PDF and ePub downloads, according to the available data) and Abstracts Views on Vision4Press platform.
Data correspond to usage on the plateform after 2015. The current usage metrics is available 48-96 hours after online publication and is updated daily on week days.
Initial download of the metrics may take a while.