Fig. 14
Download original image
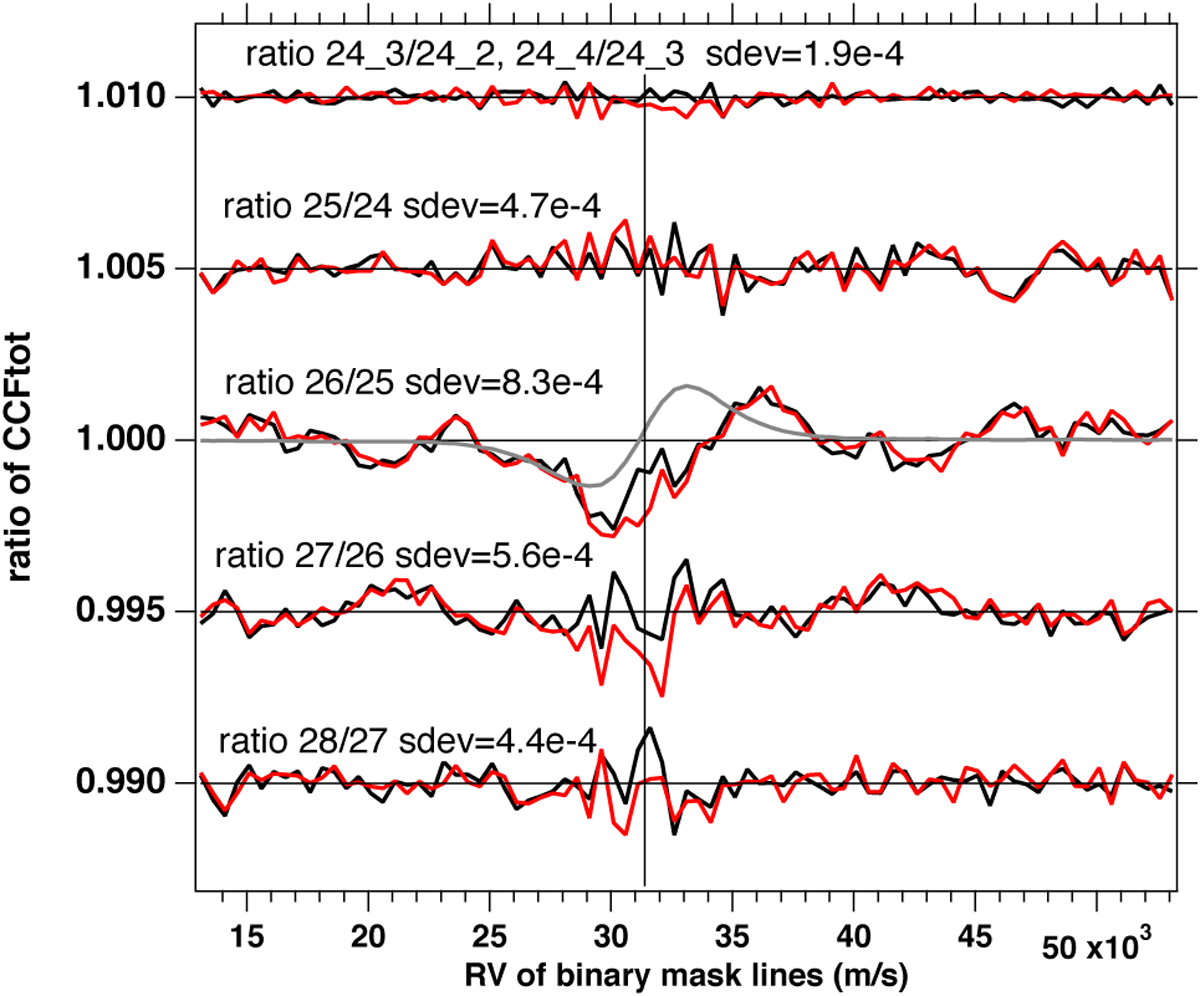
Ratios of pairs of CCFtot taken one day apart along the HD 40307 campaign. They are plotted as a function of RV(i), the abscissae of the CCF. There are two pairs for each couple of consecutive nights. The ratios are vertically displaced by multiples of 0.005 for each pair for clarity. The first and second pair of the night are respectively in red and in black. The standard deviation of the curve is indicated. The upper curves are two ratios of night 24, whose wiggles are small and likely representative of the noise level for all curves. There is a marked departure from flatness for the ratio 26/25, as expected from the Kepler fit RV drop between nights 25 and 26. However, the observed ratio is very different from a model ratio in the case of a pure Doppler shift, as can be seen from the comparison with the superimposed model for a pure shift of –5 m s−1 (gray curve). Therefore, this set of curves indicates directly a change in shape between the two nights.
Current usage metrics show cumulative count of Article Views (full-text article views including HTML views, PDF and ePub downloads, according to the available data) and Abstracts Views on Vision4Press platform.
Data correspond to usage on the plateform after 2015. The current usage metrics is available 48-96 hours after online publication and is updated daily on week days.
Initial download of the metrics may take a while.