Fig. 13
Download original image
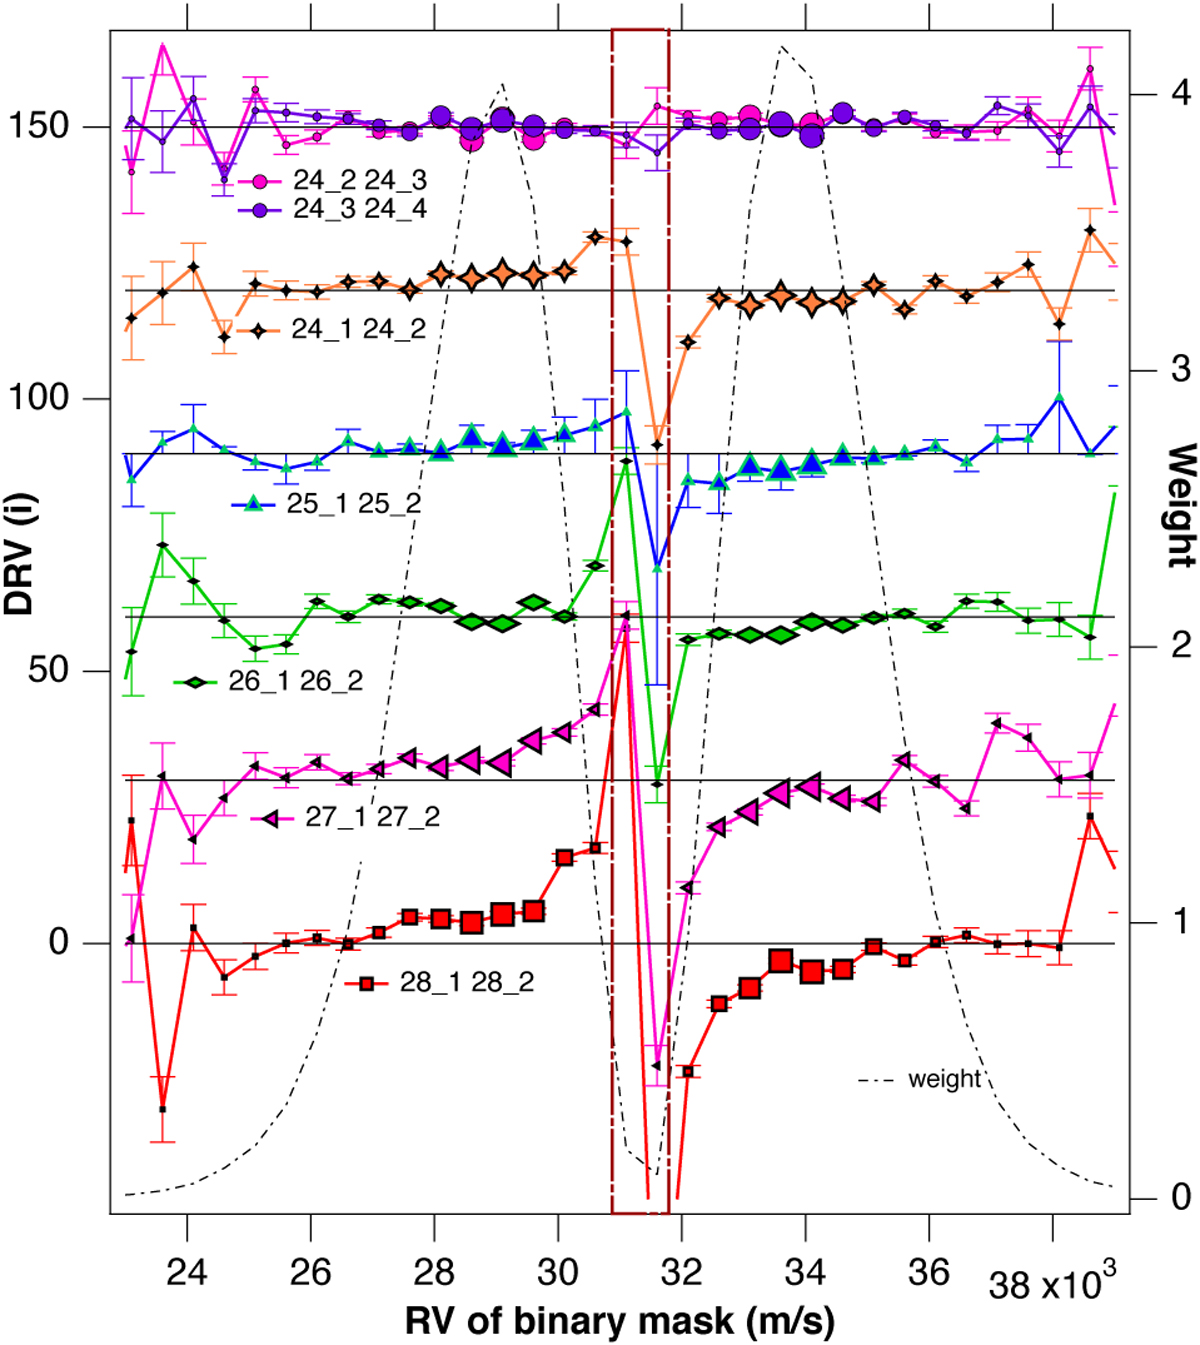
EPiCA profiles DRV(i) along the velocity grid for pairs of time periods (lines with markers). Offsets of 30 m s−1 are applied between two consecutive profiles, except for the two top curves, which are plotted together. The actual zero value is indicated by a black thin line. The size of the markers is increasing with the individual weight for each series. A typical weight function is also plotted (thin dot-dashed line). The two most central values suffer from additional uncertainties due to the limited velocity sampling and are delimited by a rectangle. (Top curves) For pairs made of the second to fourth parts of night 24, the profiles are flat within the error bars, showing no significant change in shape; this is consistent with the constancy observed using ratios, pointing to a stabilization of the instrument. For each of the other pairs (lower curves) containing the first and second parts of a night, one can observe departures from a flat profile, and a similar shape with an amplitude increasing from night 24 to night 28. This typical shape of DRV(i) is induced by a decrease in contrast (see text), consistent with the same type of behavior as the bump measured using CCF ratios (Fig. 12). It could be due to a stellar process or to an artifact.
Current usage metrics show cumulative count of Article Views (full-text article views including HTML views, PDF and ePub downloads, according to the available data) and Abstracts Views on Vision4Press platform.
Data correspond to usage on the plateform after 2015. The current usage metrics is available 48-96 hours after online publication and is updated daily on week days.
Initial download of the metrics may take a while.