Fig. 12
Download original image
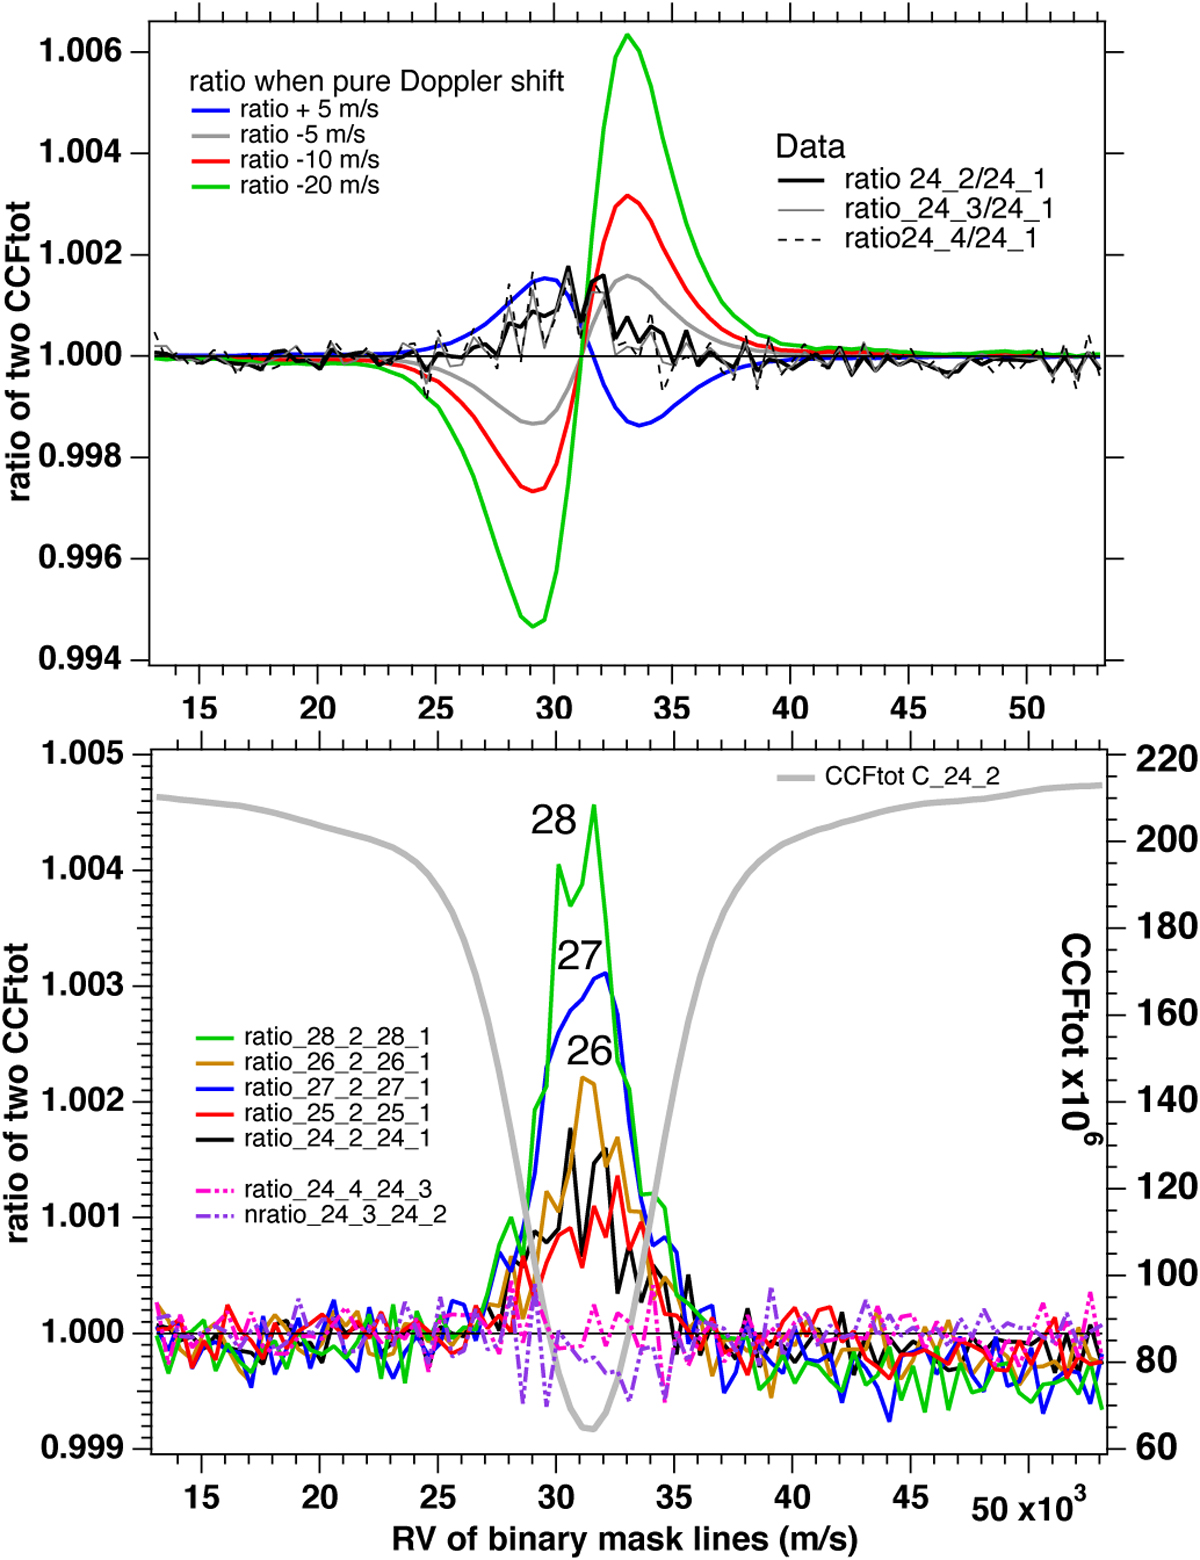
Model-data comparison using CCF ratios. Top: expected ratio of two CCFs with unchanged shape and various Doppler shifts (colored lines), and ratios using the four periods of night 24 (black lines). The same curve is observed for ratios of parts 2, 3, and 4 to part 1. It does not resemble the expected variation for a simple shift and indicates a change in shape during the first and second parts of the night. Bottom: ratios of pairs formed by the first two consecutive stacked CCFtot obtained during the same night, for nights 24 to 28 (numbers indicated on the plot for 26 to 28). One CCFtot is drawn (gray line). There is a systematic bump centered on the CCFtot, indicative of an increase in signal near the center during the first and second parts of each daily pair. The increase is larger for the latest nights. The ratio for the two last parts of night 24 is shown for comparison (pink line). There is no increase in this case, a sign of absence of shape variation during this period.
Current usage metrics show cumulative count of Article Views (full-text article views including HTML views, PDF and ePub downloads, according to the available data) and Abstracts Views on Vision4Press platform.
Data correspond to usage on the plateform after 2015. The current usage metrics is available 48-96 hours after online publication and is updated daily on week days.
Initial download of the metrics may take a while.