Fig. 4
Download original image
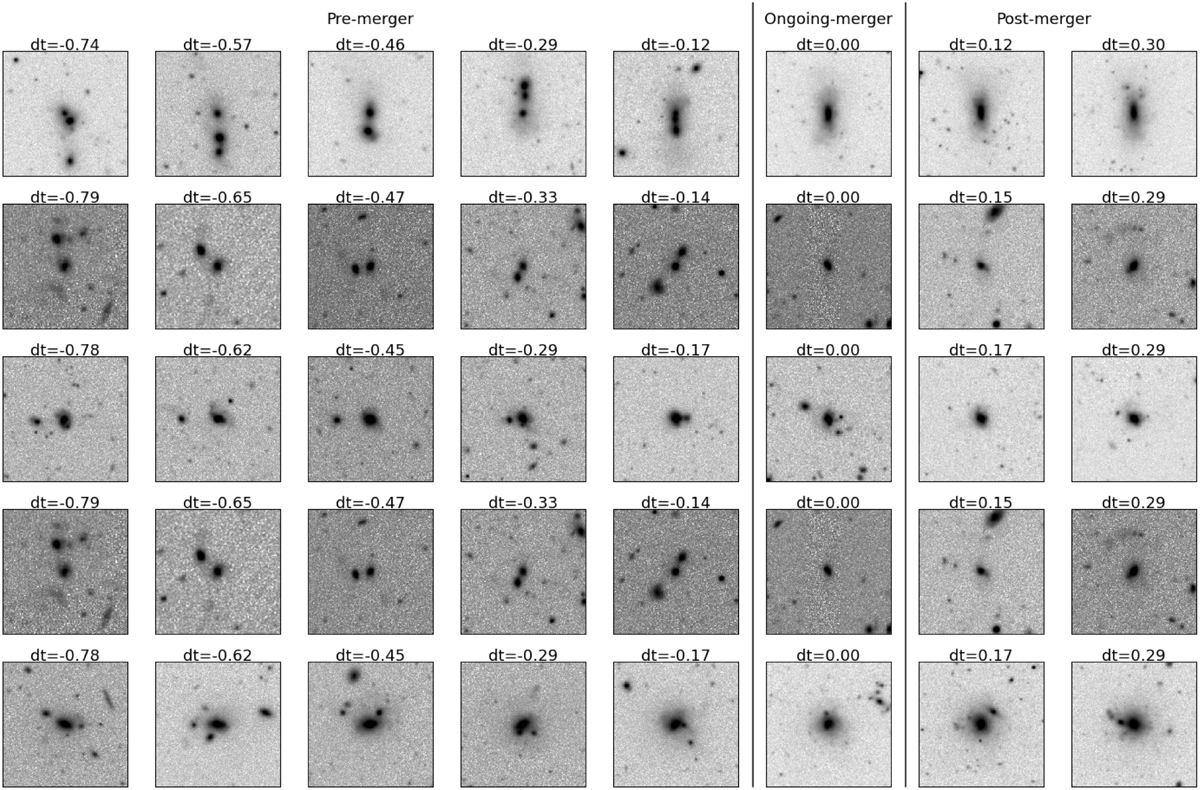
Example mergers from TNG at different merger stages (obtained from the corresponding merger trees in the simulation): pre-mergers (−0.8 < dt < −0.1 Gyr), ongoing-mergers (−0.1 < dt < 0.1 Gyr), and post-mergers (0.1 < dt < 0.3 Gyr). Each row shows a galaxy along its merger sequence. Images have an approximate physical size of 160 kpc, displayed using an arcsinh inverted grey scale.
Current usage metrics show cumulative count of Article Views (full-text article views including HTML views, PDF and ePub downloads, according to the available data) and Abstracts Views on Vision4Press platform.
Data correspond to usage on the plateform after 2015. The current usage metrics is available 48-96 hours after online publication and is updated daily on week days.
Initial download of the metrics may take a while.