Fig. 3.
Download original image
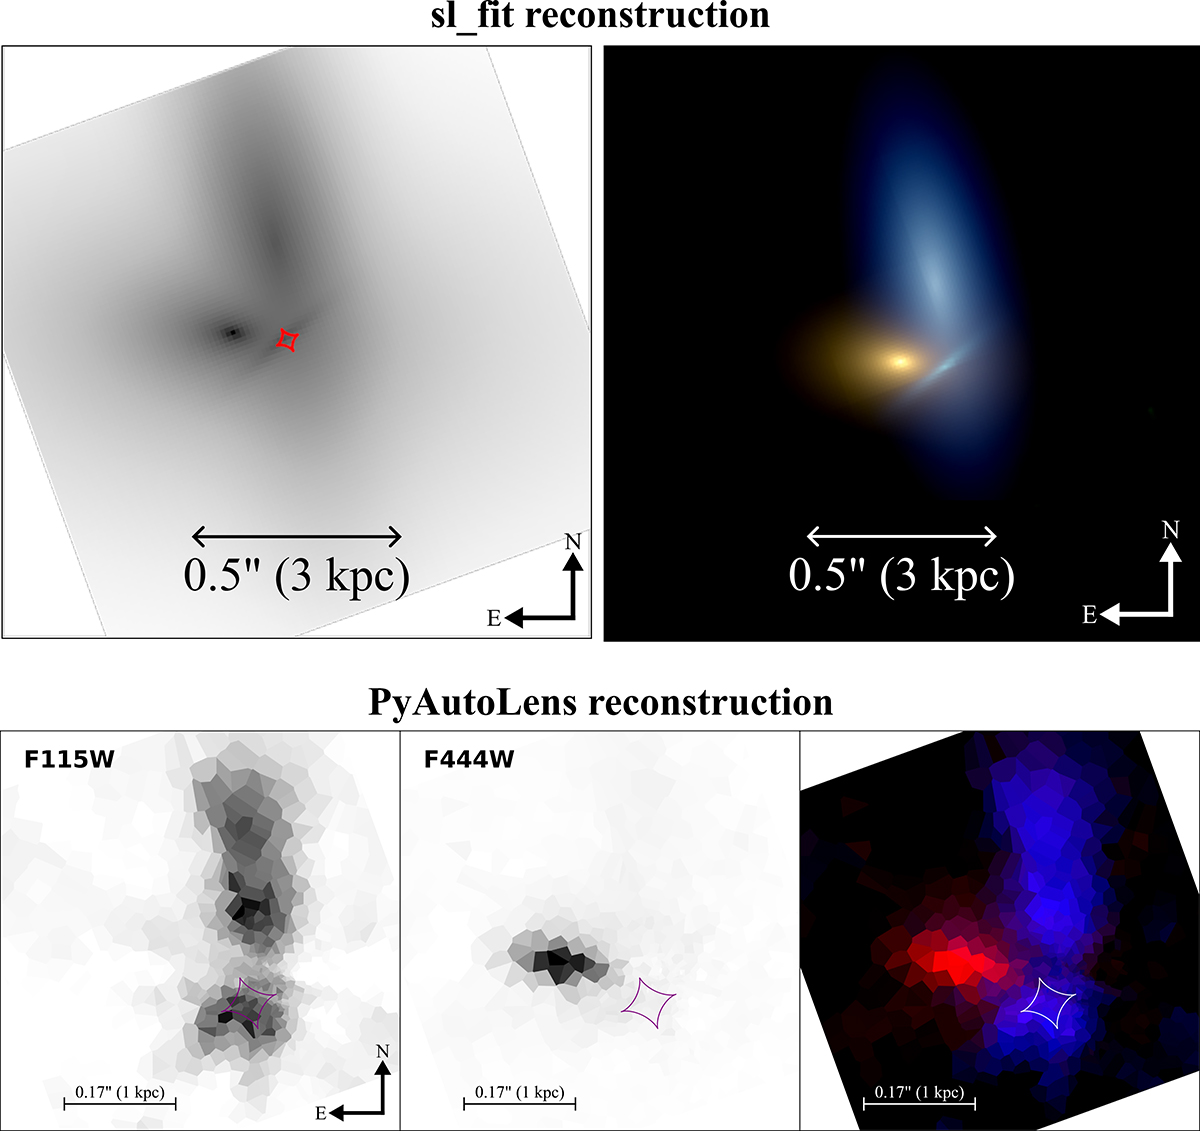
Source plane reconstructions from SL_FIT and PYAUTOLENS. Top row: gray-scale rendering of the SL_FIT reconstructed background source morphology in the F277W band on the left and false color representation on the right obtained by combining reconstructions of the source in the F444W (red channel), F277W (green channel), and F150W (blue channel) bands. Caustic lines are overlaid in red. Bottom row: source reconstruction from PYAUTOLENS in the JWST/NIRCam F115W band (left-hand plot) and in the F444W band (middle plot) bands using identical mass models. The right-hand plot represents the superposition of the two reconstructions with F115W in blue and F444W in red. In each panel, the caustic lines are shown. North is up and east is to the left. We note that, because of the mass-sheet degeneracy (e.g., Liesenborgs & De Rijcke 2012), the scales between the two source reconstructions cannot be directly compared.
Current usage metrics show cumulative count of Article Views (full-text article views including HTML views, PDF and ePub downloads, according to the available data) and Abstracts Views on Vision4Press platform.
Data correspond to usage on the plateform after 2015. The current usage metrics is available 48-96 hours after online publication and is updated daily on week days.
Initial download of the metrics may take a while.