Fig. A.4.
Download original image
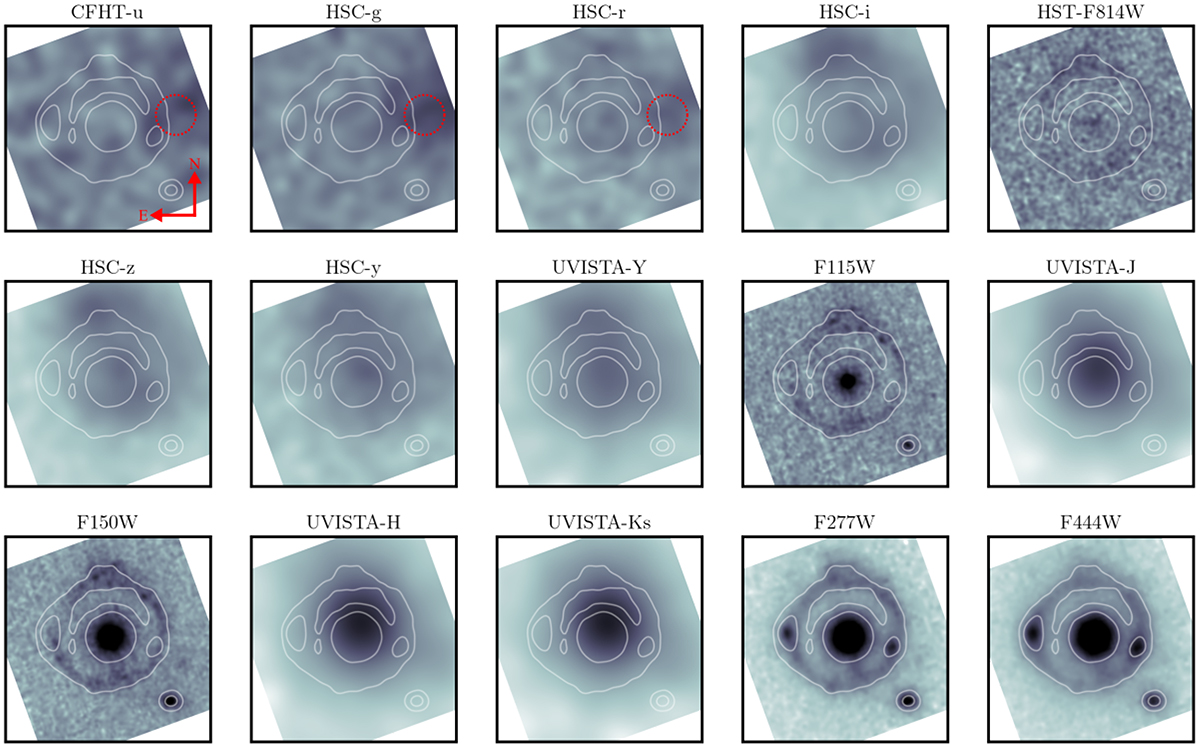
Cutouts of ×3″ of the Einstein ring in all bands. Images are sorted from the bluest to the reddest band going left to right and top to bottom. Each image is scaled using a square root function and ZScale intervals to enhance the contrast between the bright lens and the fainter surrounding ring. Contours from the detection image of SOURCEXTRACTOR++ are shown in all images as white lines. The circle with red dotted lines show the location of the nearby UV-bright contaminant discussed in Sect. 2.2 and in Fig. 5. North is up and east is to the left.
Current usage metrics show cumulative count of Article Views (full-text article views including HTML views, PDF and ePub downloads, according to the available data) and Abstracts Views on Vision4Press platform.
Data correspond to usage on the plateform after 2015. The current usage metrics is available 48-96 hours after online publication and is updated daily on week days.
Initial download of the metrics may take a while.