Fig. 8.
Download original image
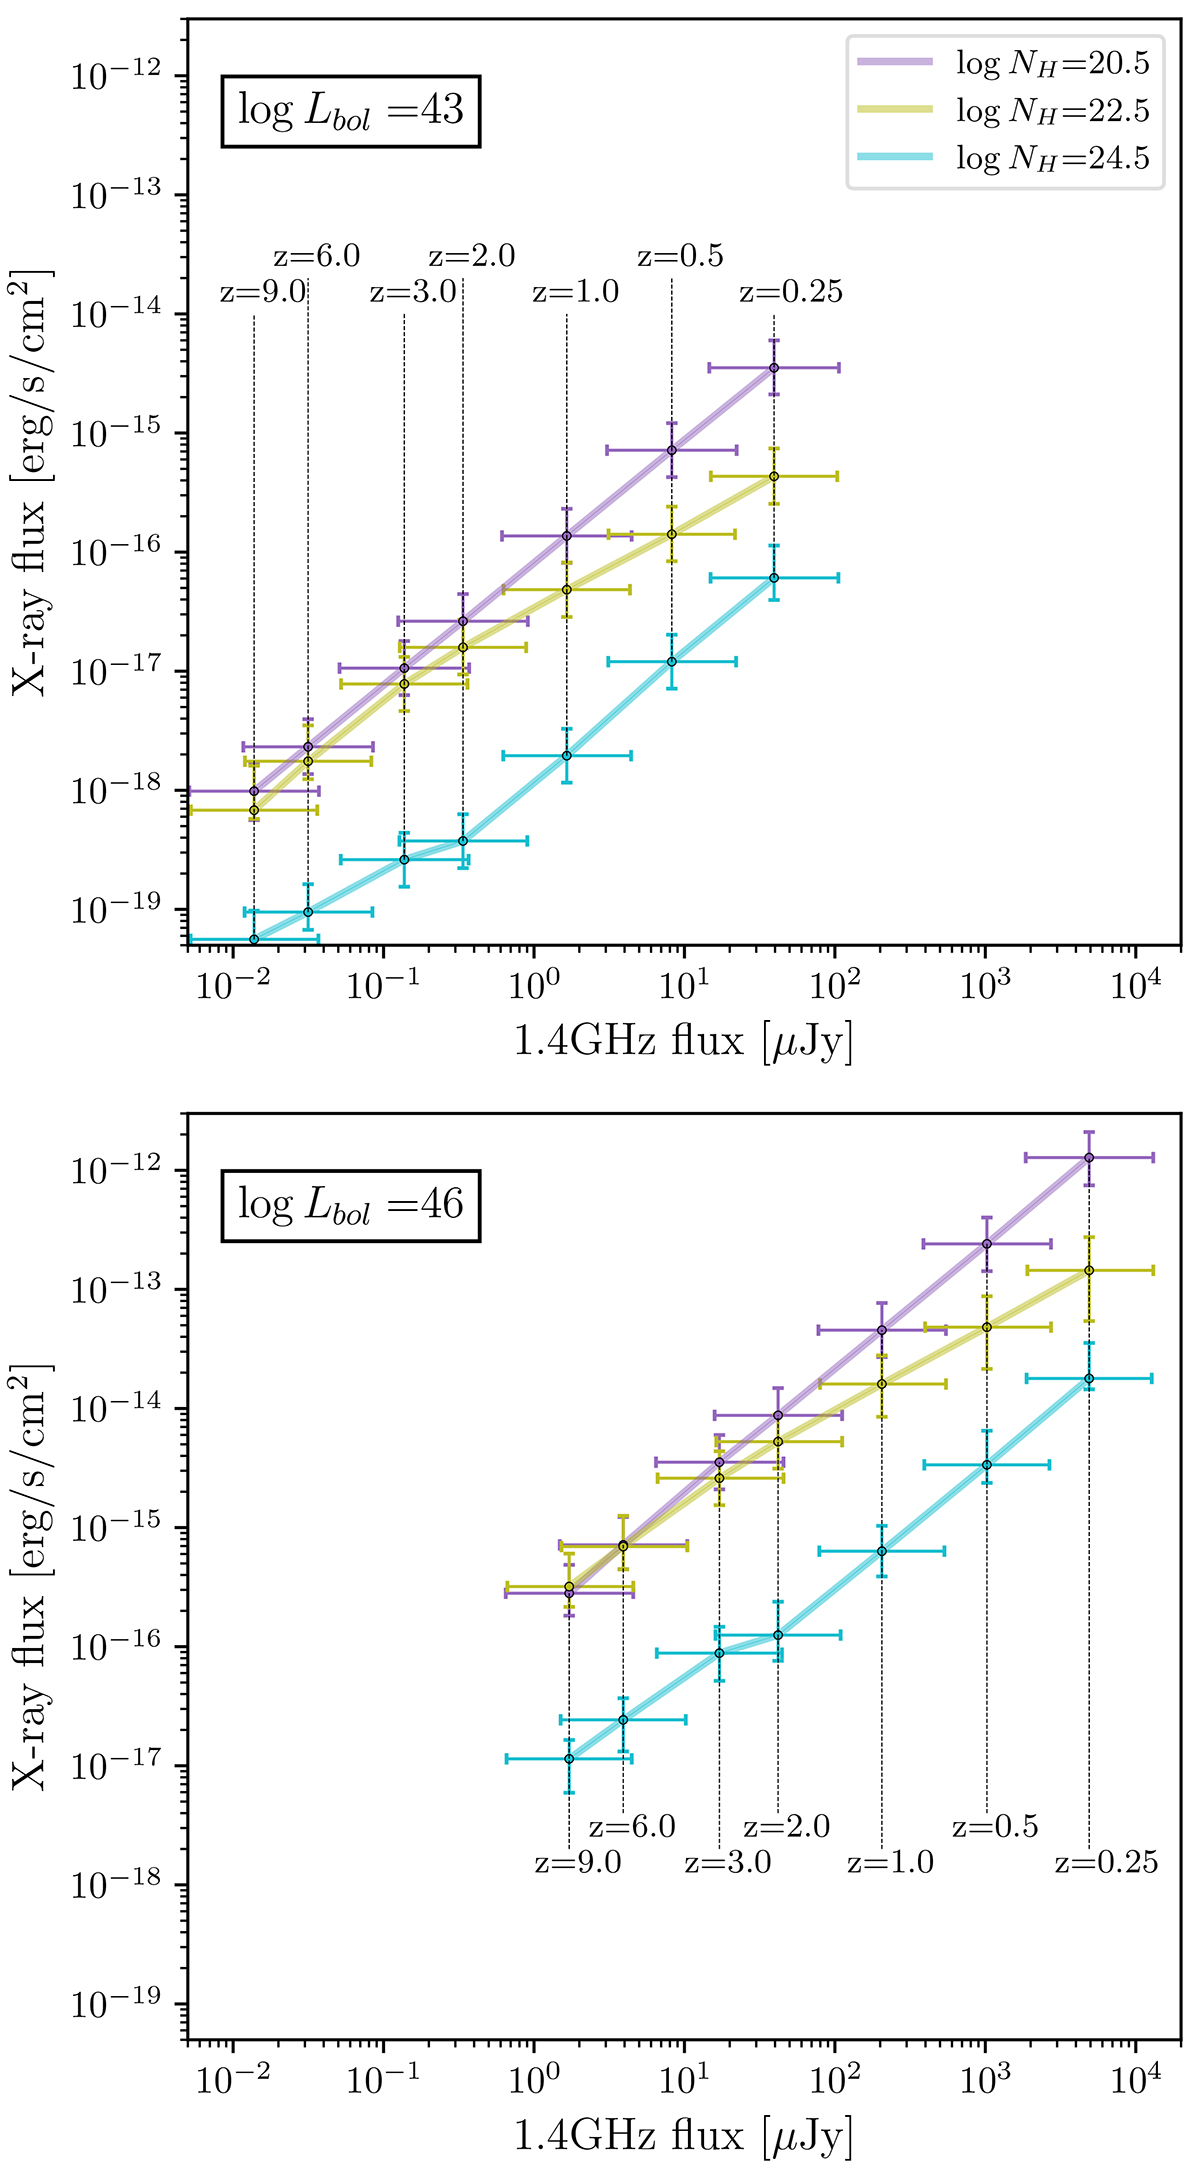
Typical SB X-ray flux versus 1.4 GHz flux at different redshifts computed for an AGN with log Lbol = 43 (upper panel) and log Lbol = 46 (lower panel). Error bars show the 1σ distribution values due to the scatter in the Lbol − LHX relation (vertical error bar), and in the L1.4 GHz−LHX relation (horizontal error bar). The dashed lines indicate the redshift at which the fluxes are computed.
Current usage metrics show cumulative count of Article Views (full-text article views including HTML views, PDF and ePub downloads, according to the available data) and Abstracts Views on Vision4Press platform.
Data correspond to usage on the plateform after 2015. The current usage metrics is available 48-96 hours after online publication and is updated daily on week days.
Initial download of the metrics may take a while.