Open Access
Fig. 6.
Download original image
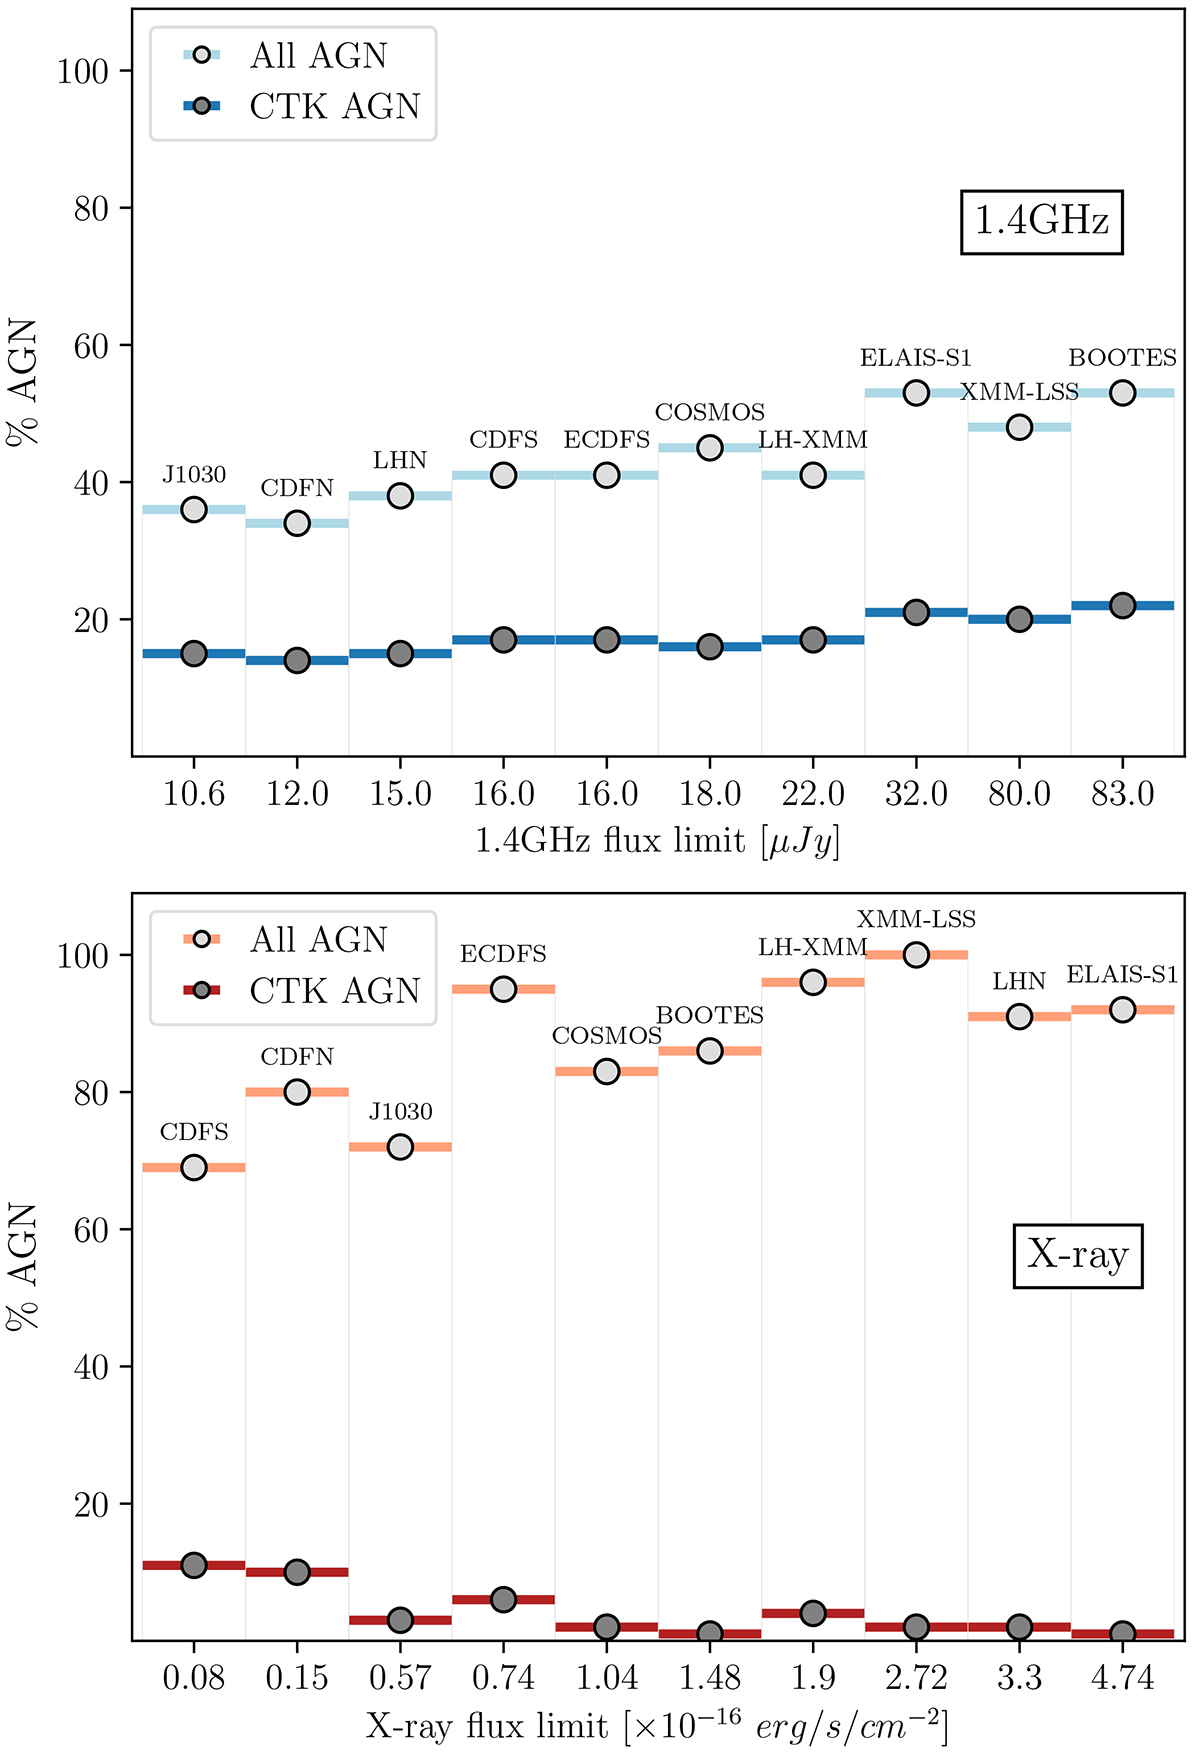
Upper panel: predicted fractions of AGN (light blue) and CTK AGN (dark blue) as a function of radio survey flux limit. Lower panel: same as in the upper panel but for the X-ray predictions. In both panels the surveys are sorted on the x-axis by increasing flux limit (faintest source in the catalog).
Current usage metrics show cumulative count of Article Views (full-text article views including HTML views, PDF and ePub downloads, according to the available data) and Abstracts Views on Vision4Press platform.
Data correspond to usage on the plateform after 2015. The current usage metrics is available 48-96 hours after online publication and is updated daily on week days.
Initial download of the metrics may take a while.