Fig. 4.
Download original image
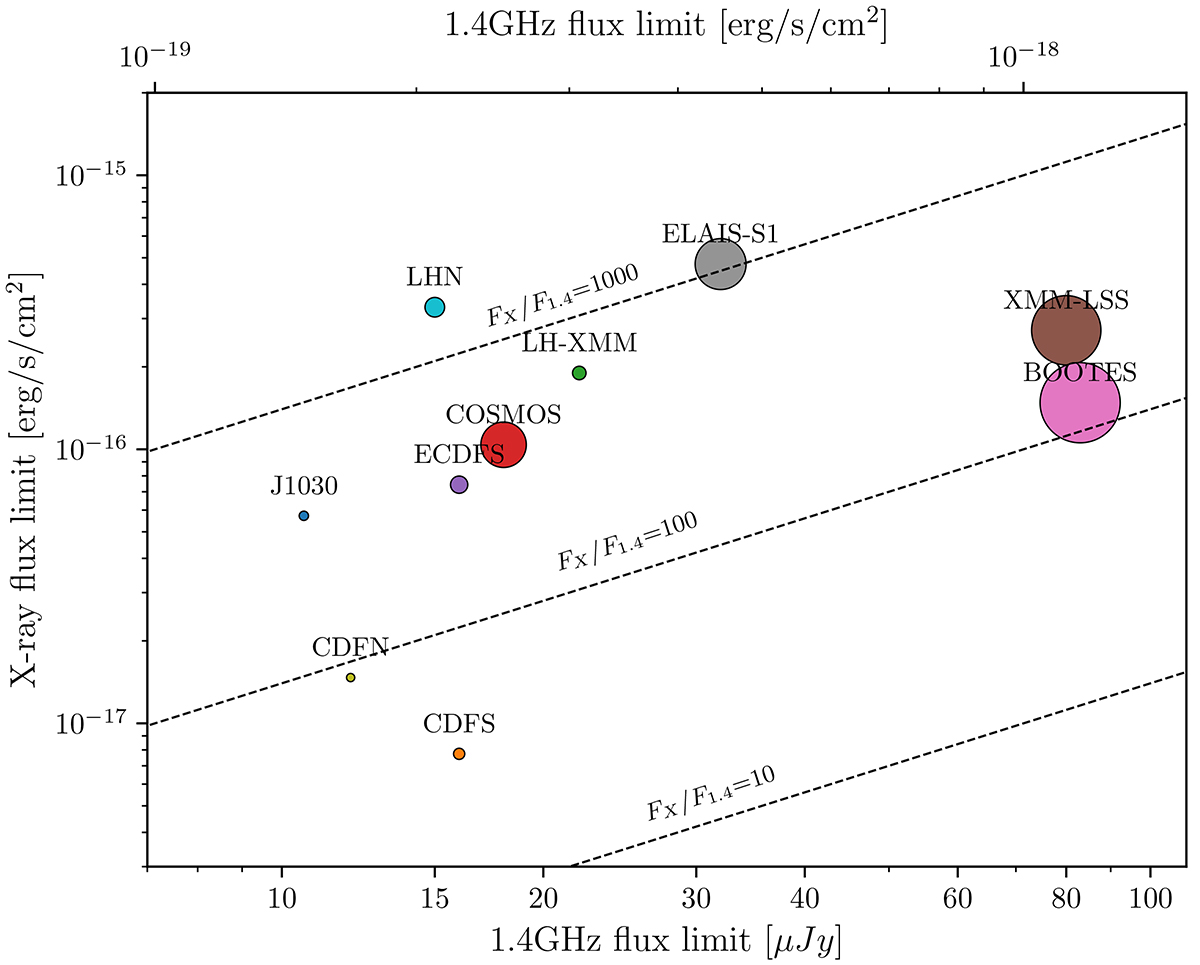
Distribution of the 0.5 − 2 keV versus 1.4 GHz flux limit for the ten radio and X-ray fields considered in this work. The reported flux limits correspond to the faintest sources’ flux in the 0.5 − 2 keV and in the 1.4 GHz catalogs, respectively. Each field marker size is proportional to the area of the overlapping region between the radio and X-ray observations. The three dashed lines correspond to level curves for different ratios between the X-ray and radio fluxes.
Current usage metrics show cumulative count of Article Views (full-text article views including HTML views, PDF and ePub downloads, according to the available data) and Abstracts Views on Vision4Press platform.
Data correspond to usage on the plateform after 2015. The current usage metrics is available 48-96 hours after online publication and is updated daily on week days.
Initial download of the metrics may take a while.