Fig. 3.
Download original image
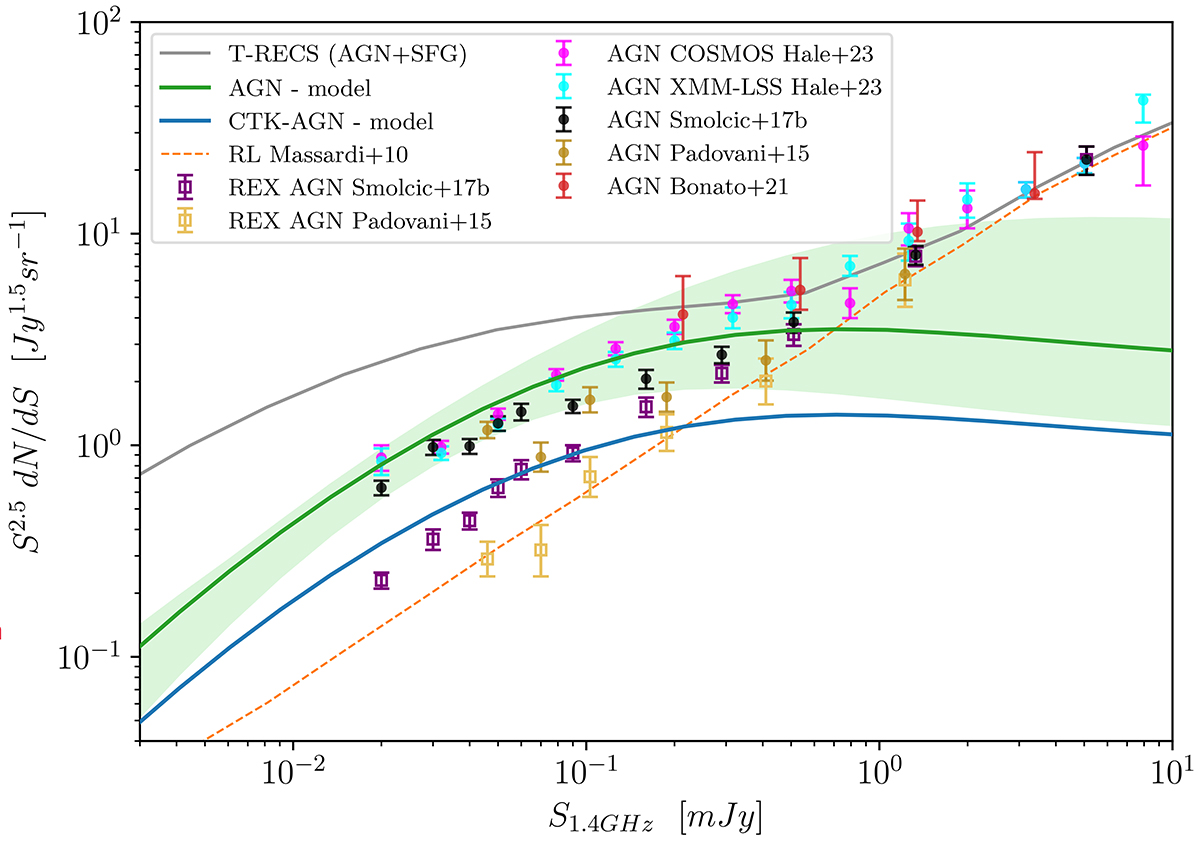
Differential AGN number counts (NCs) derived with our model for all AGN (green line and shaded area) and CTK AGN (blue curve), compared with AGN NCs derived in the literature from different radio fields, as labeled. The uncertainties on the CTK NCs are of the same order as those of the whole AGN population but are not reported for clarity. NCs measured for the whole radio AGN population in the different works are shown as filled points, while the REX AGN only are shown as empty squares. The gray curve shows the NCs of AGN plus SFG predicted by the T-RECS simulations, while the orange curve shows the radio-loud AGN NCs derived from Massardi et al. (2010).
Current usage metrics show cumulative count of Article Views (full-text article views including HTML views, PDF and ePub downloads, according to the available data) and Abstracts Views on Vision4Press platform.
Data correspond to usage on the plateform after 2015. The current usage metrics is available 48-96 hours after online publication and is updated daily on week days.
Initial download of the metrics may take a while.