Fig. 2.
Download original image
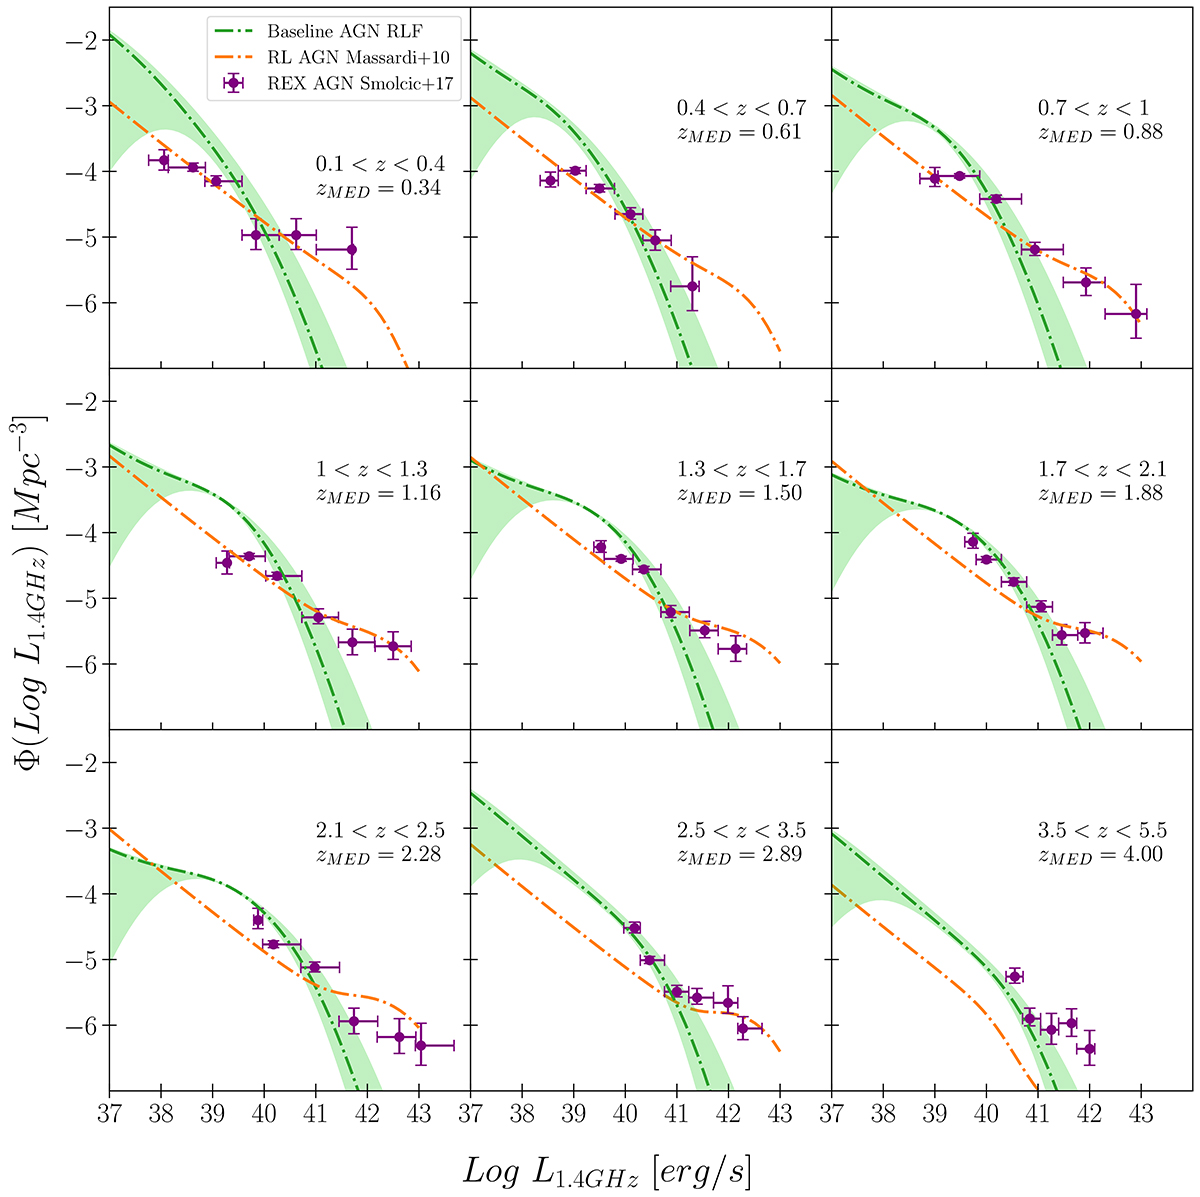
Baseline RLF of all AGN derived from our model (green line) compared to the REX AGN RLF (purple data points) measured by Smolčić et al. (2017c). Different redshift ranges are investigated, as labeled. The boundaries of the shaded area represent the uncertainty region of the RLF as described in Sect. 2.2. In all panels we also report in orange the RL luminosity function empirically derived by Massardi et al. (2010).
Current usage metrics show cumulative count of Article Views (full-text article views including HTML views, PDF and ePub downloads, according to the available data) and Abstracts Views on Vision4Press platform.
Data correspond to usage on the plateform after 2015. The current usage metrics is available 48-96 hours after online publication and is updated daily on week days.
Initial download of the metrics may take a while.