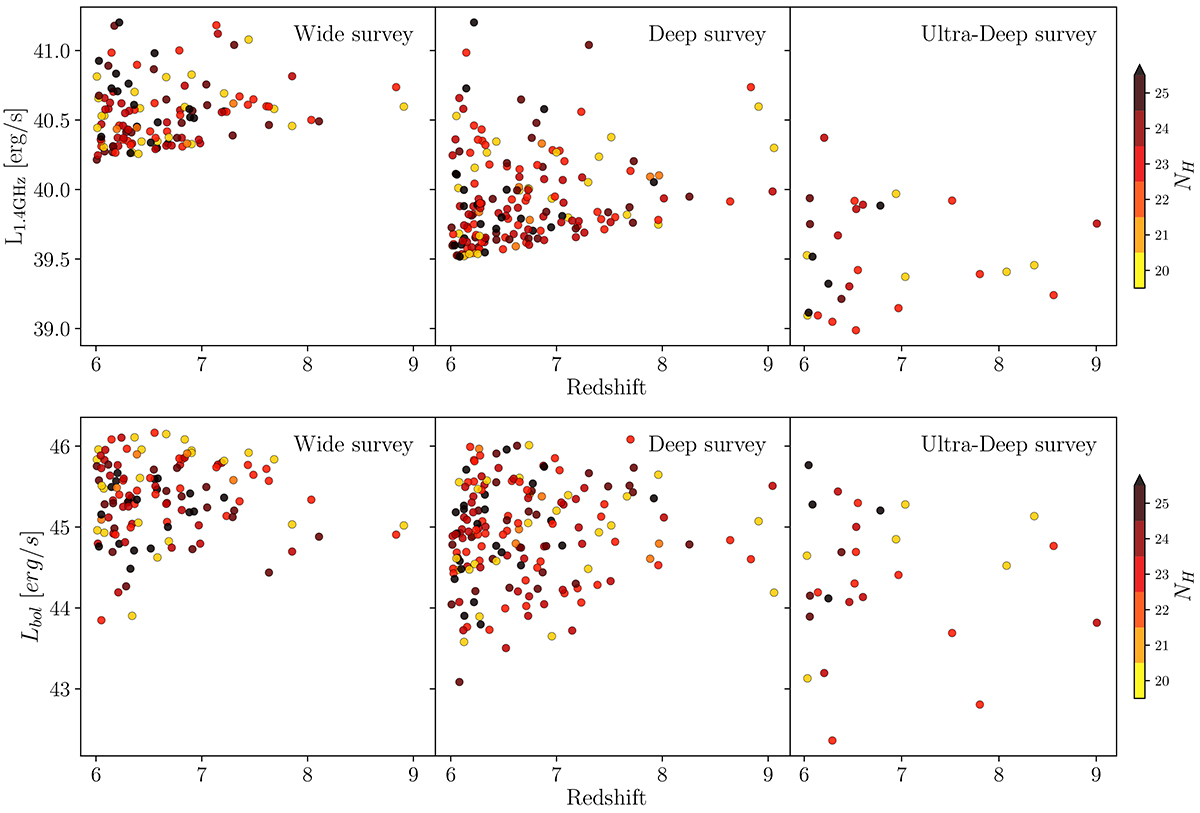
Fig. 11.
Download original image
Simulated z > 6 AGN to be detected by SKAO in the three tiers of its continuum 1.4 GHz surveys. Each point is color-coded according to its obscuration level. The top three panels show the distribution of log L1.4 GHz while the bottom panels show the distribution of log Lbol. The number of simulated sources in the Wide survey panels is almost 1/10 of the number of AGN reported in Table 4 (see text for details).
Current usage metrics show cumulative count of Article Views (full-text article views including HTML views, PDF and ePub downloads, according to the available data) and Abstracts Views on Vision4Press platform.
Data correspond to usage on the plateform after 2015. The current usage metrics is available 48-96 hours after online publication and is updated daily on week days.
Initial download of the metrics may take a while.