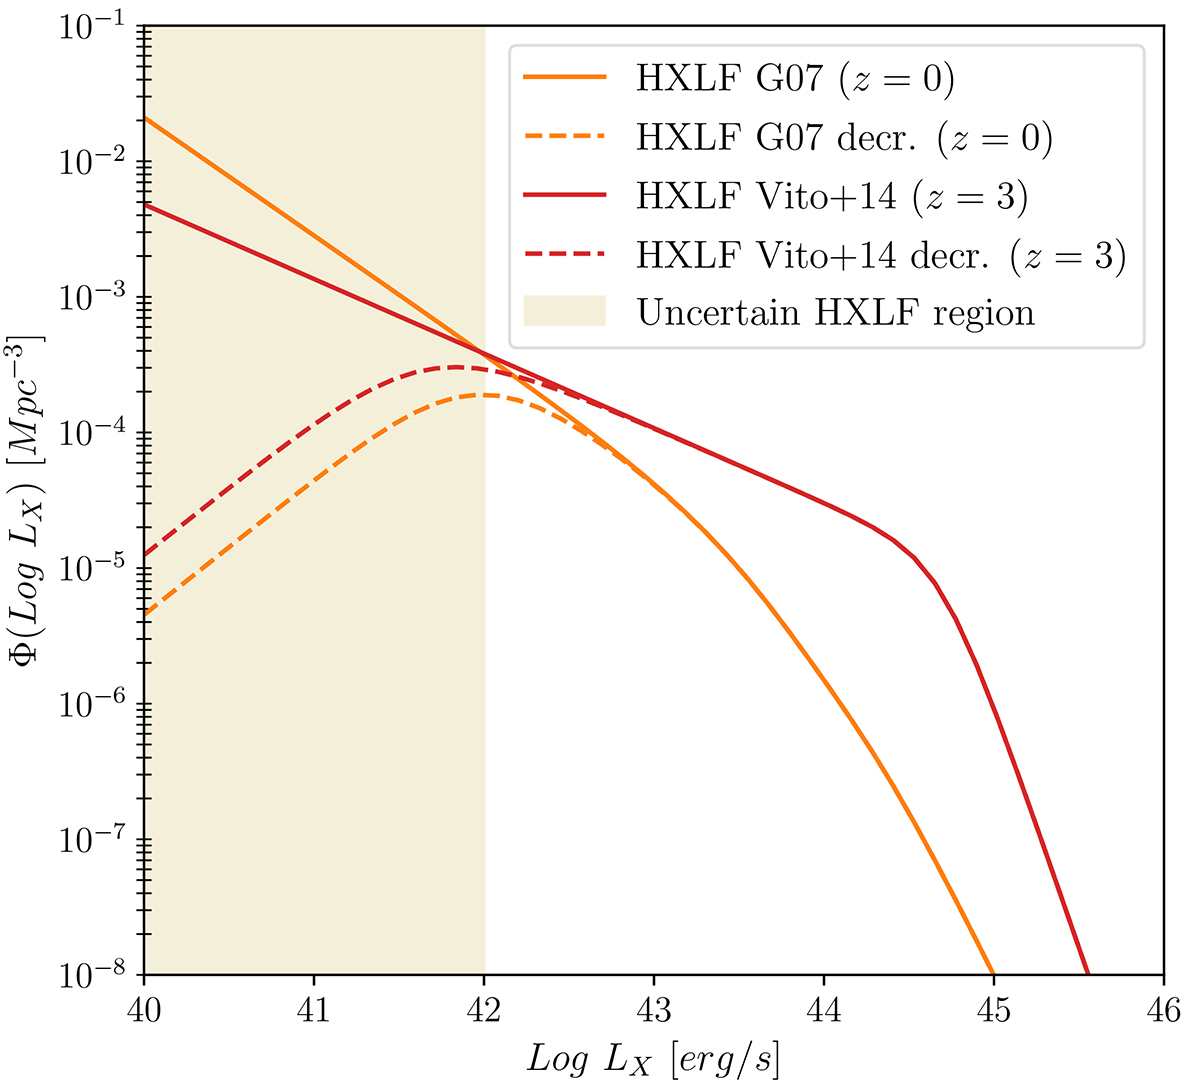
Fig. 1.
Download original image
HXLF of all AGN obtained following the prescription of the CXB model in G07 and computed at z = 0 (solid orange line). The dashed orange line is the same HXLF but introducing a cutoff at log LX < 42, where the HXLF measurements are most uncertain. The red curve represents the HXLF as derived by Vito et al. (2014), computed at z = 3, and implemented as the baseline model for z > 3. The dashed red line is the Vito et al. (2014) HXLF with the same cutoff described above.
Current usage metrics show cumulative count of Article Views (full-text article views including HTML views, PDF and ePub downloads, according to the available data) and Abstracts Views on Vision4Press platform.
Data correspond to usage on the plateform after 2015. The current usage metrics is available 48-96 hours after online publication and is updated daily on week days.
Initial download of the metrics may take a while.