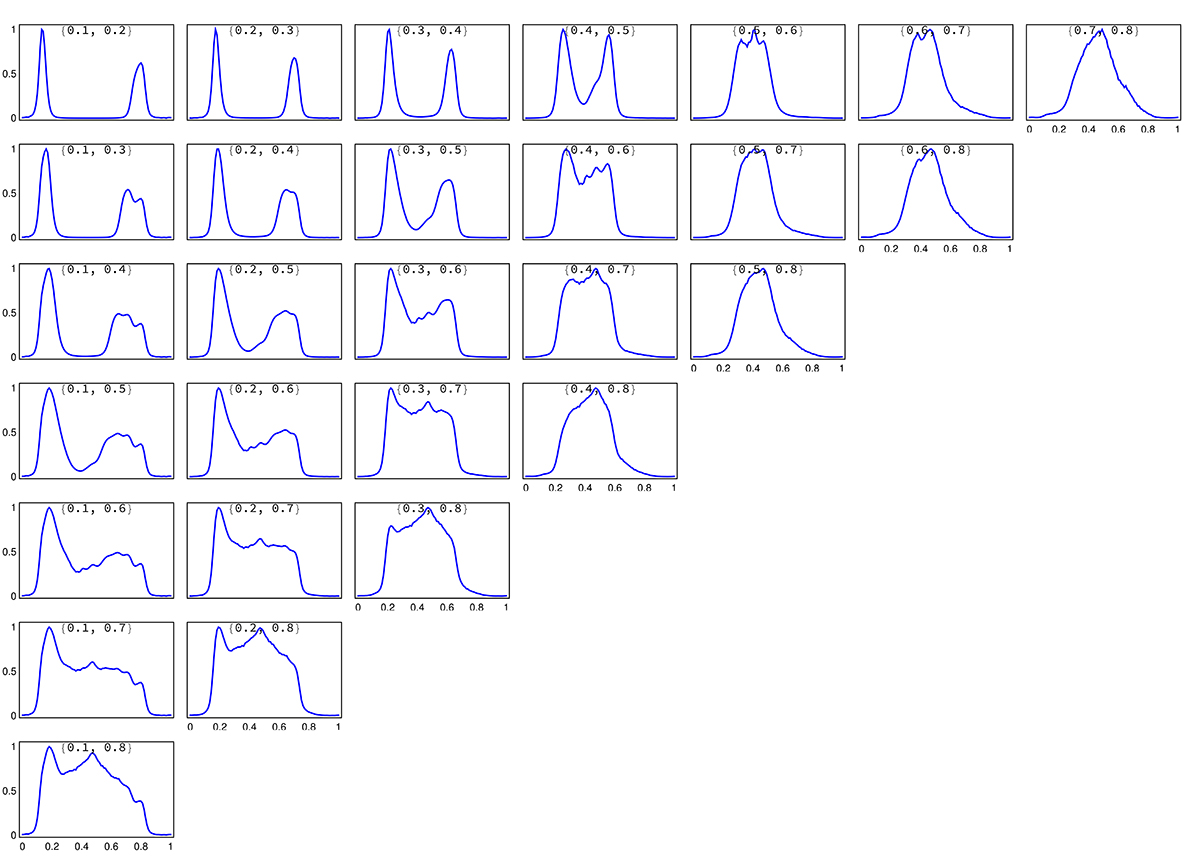
Fig. A.5.
Download original image
Evolution of the X-ray profile with altitude and extension of the emission region for χ = 45° and ζ = 44°. The legend shows the lower and upper radii, {rin/rL, rout/rL}, respectively denoted by rin and rout, for the region of the separatrix emitting in X-ray. The upper rows show the individual light curves that are progressively added together in the lower rows to the point where all are stacked to get only one possible light curve, shown by the lowest row.
Current usage metrics show cumulative count of Article Views (full-text article views including HTML views, PDF and ePub downloads, according to the available data) and Abstracts Views on Vision4Press platform.
Data correspond to usage on the plateform after 2015. The current usage metrics is available 48-96 hours after online publication and is updated daily on week days.
Initial download of the metrics may take a while.