Open Access
Fig. 8
Download original image
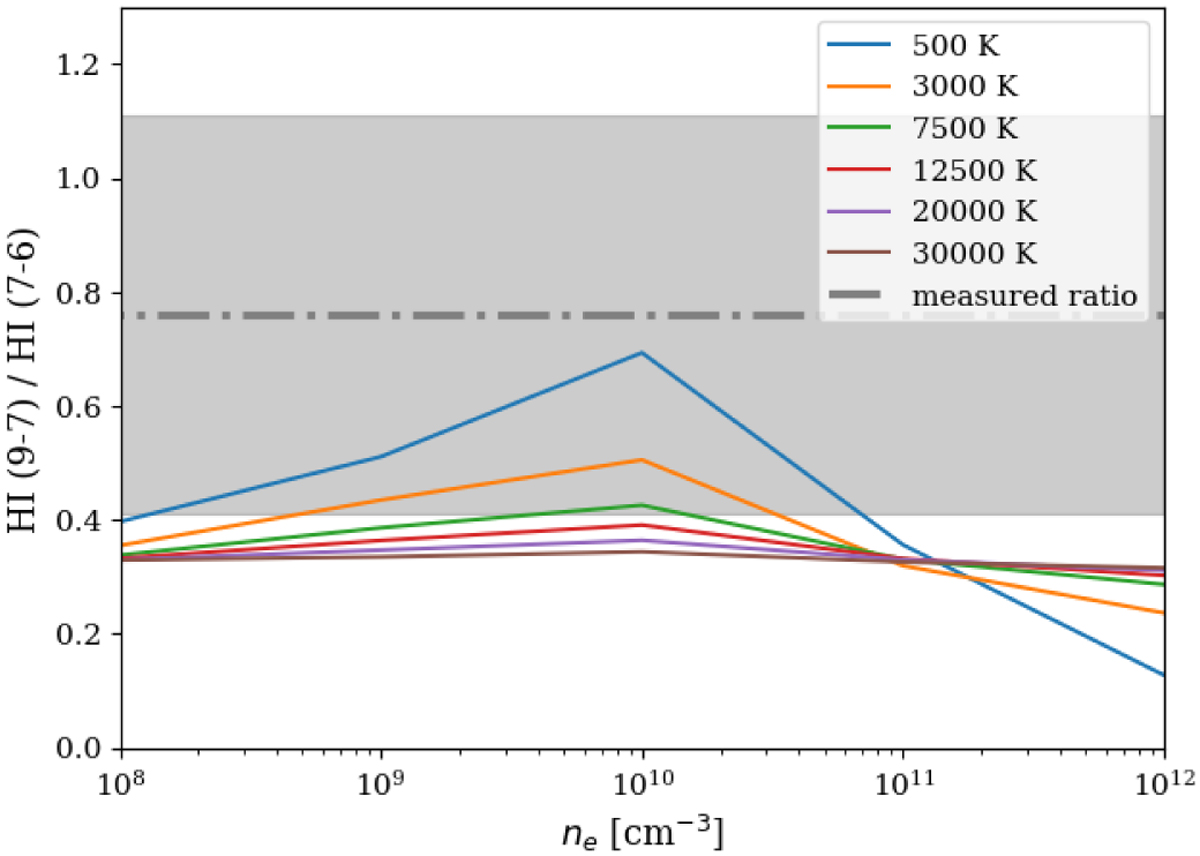
HI (9-7) and HI (7-6) line ratio as a function of electron density from the Case B recombination model compared to our measured ratio (gray dotted line). The shaded area is the uncertainty of the measured ratio.
Current usage metrics show cumulative count of Article Views (full-text article views including HTML views, PDF and ePub downloads, according to the available data) and Abstracts Views on Vision4Press platform.
Data correspond to usage on the plateform after 2015. The current usage metrics is available 48-96 hours after online publication and is updated daily on week days.
Initial download of the metrics may take a while.