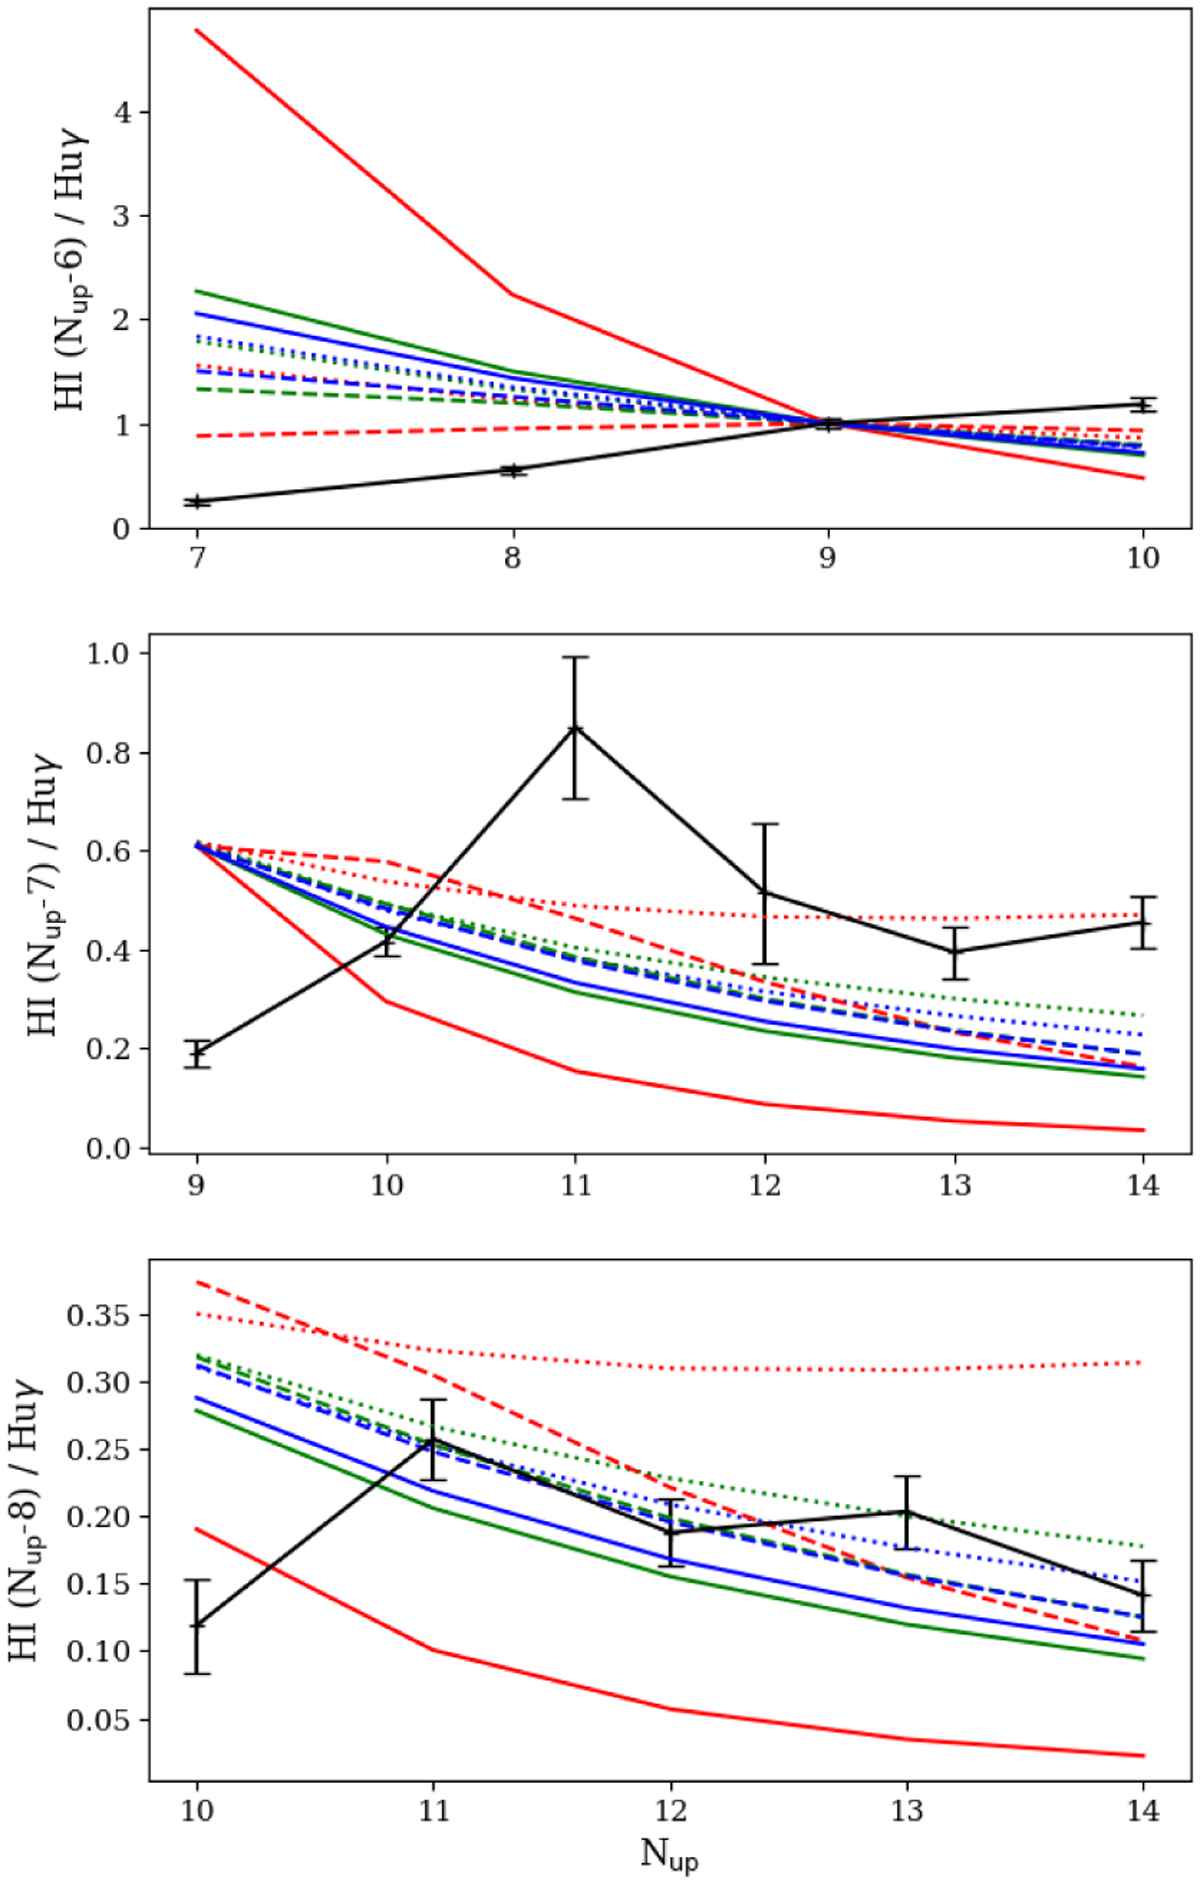
Fig. 7
Download original image
Comparison of the three detected line series to the Case B model predictions. The solid black lines show the observed line fluxes for transition with lower energy levels (from top to bottom) 6, 7, and 8 relative to the reference line HI (9-6). The lines with different colors are the predicted values by the Case B model for different densities and temperatures of the emitting gas. The model densities are 108 cm−3 (dotted line), 1010 cm−3 (slashed line), and 1012 cm−3. The temperatures are 500 K (red), 5000 K (green), and 10 000 K (blue).
Current usage metrics show cumulative count of Article Views (full-text article views including HTML views, PDF and ePub downloads, according to the available data) and Abstracts Views on Vision4Press platform.
Data correspond to usage on the plateform after 2015. The current usage metrics is available 48-96 hours after online publication and is updated daily on week days.
Initial download of the metrics may take a while.