Open Access
Fig. 6
Download original image
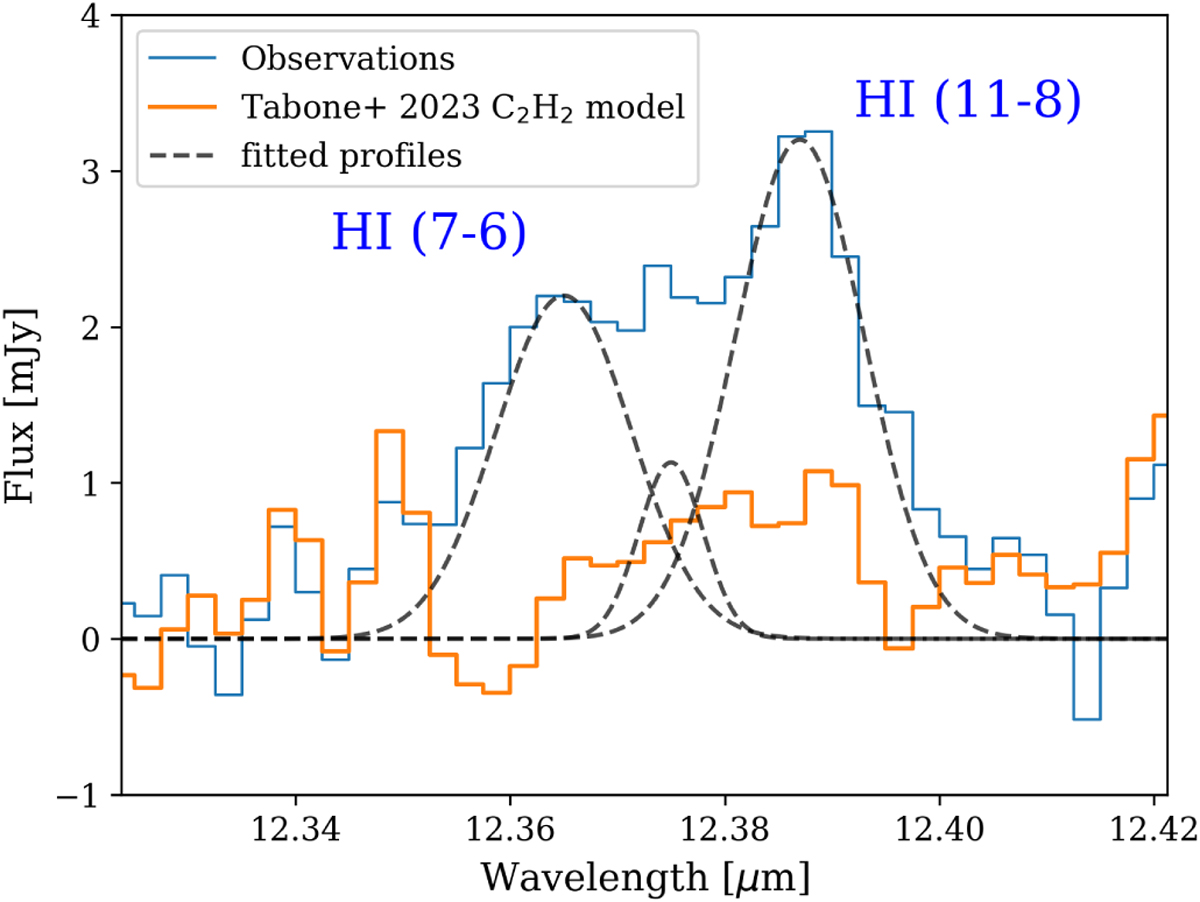
Emission lines used to measure the accretion rates. The black dashed profile on the left is the HI (7-6) line, the one on the right is the HI (11-8) line, while the central component is C2H2 emission, according to the predictions of Tabone et al. (2023, the orange profile).
Current usage metrics show cumulative count of Article Views (full-text article views including HTML views, PDF and ePub downloads, according to the available data) and Abstracts Views on Vision4Press platform.
Data correspond to usage on the plateform after 2015. The current usage metrics is available 48-96 hours after online publication and is updated daily on week days.
Initial download of the metrics may take a while.