Open Access
Fig. 5
Download original image
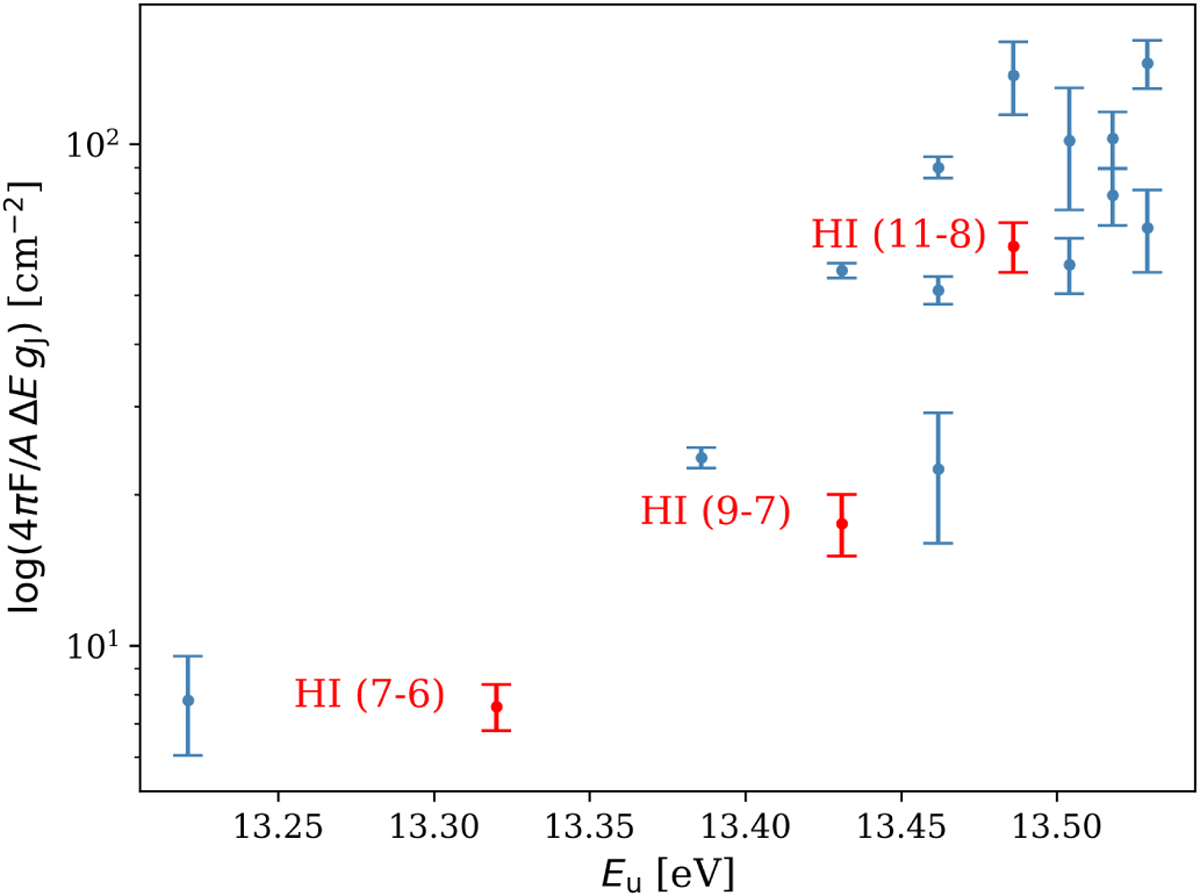
Excitation diagram of the HI lines. These lines are produced by shocked material for which the Boltzmann distribution does not apply, therefore the y-axis is in terms of integrated line flux rather than column density. In red, we highlight the lines used for the comparison to atomic line emission models.
Current usage metrics show cumulative count of Article Views (full-text article views including HTML views, PDF and ePub downloads, according to the available data) and Abstracts Views on Vision4Press platform.
Data correspond to usage on the plateform after 2015. The current usage metrics is available 48-96 hours after online publication and is updated daily on week days.
Initial download of the metrics may take a while.