Open Access
Fig. 3
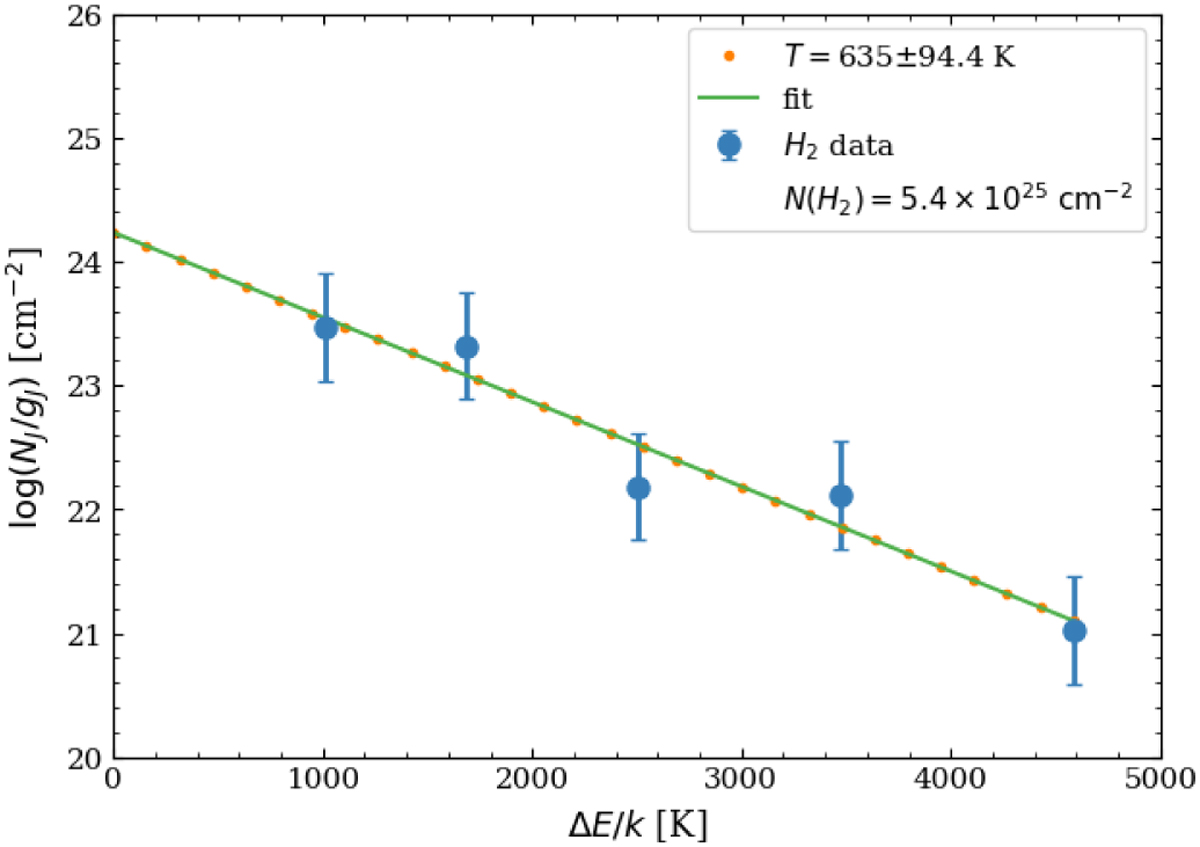
Download original image
Rotation diagram of H2 rotational transitions. A linear fit was performed on the measured fluxes, and the diagram shows a single component for the emitting gas with a temperature of about 635 K and mass 2.5 × 10⁻⁵MJup.
Current usage metrics show cumulative count of Article Views (full-text article views including HTML views, PDF and ePub downloads, according to the available data) and Abstracts Views on Vision4Press platform.
Data correspond to usage on the plateform after 2015. The current usage metrics is available 48-96 hours after online publication and is updated daily on week days.
Initial download of the metrics may take a while.