Fig. 2
Download original image
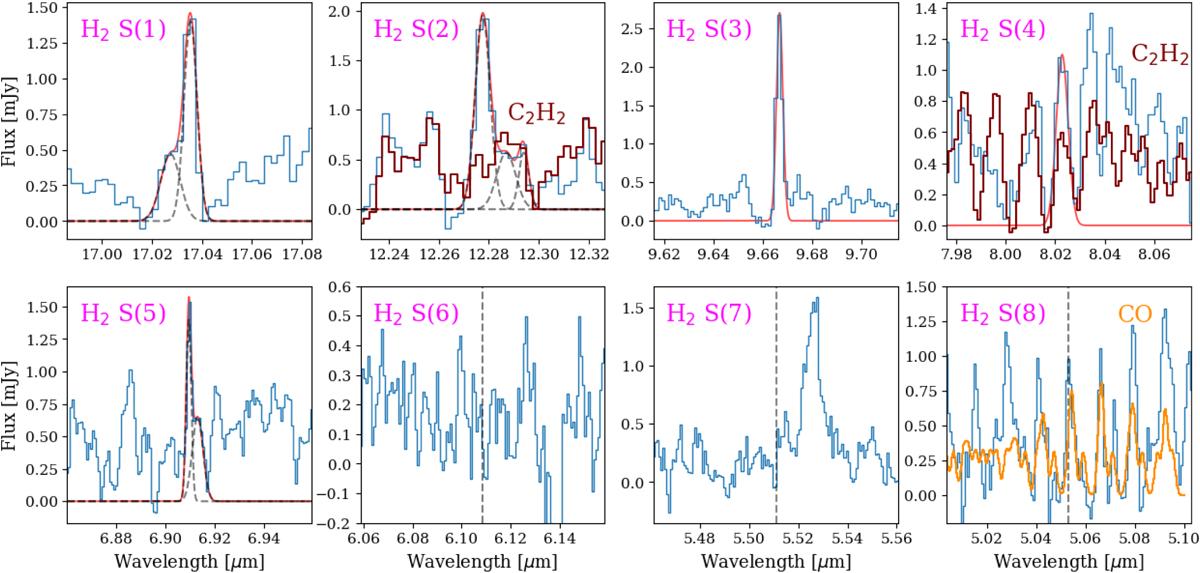
Molecular hydrogen pure rotational lines within the spectral range. The red profiles show line fitting using one or multiple Gaussian functions (dashed lines) in the case of line blending with other spectral features. The rest wavelength of the undetected lines is indicated by a slashed vertical line. In dark red we show the C2H2 rescaled model from Tabone et al. (2023) to show the features location. In orange, we show an eye-fit of a CO slab model. The S (2) line is blended with a C2H2 line. The S (6) and S (7) transitions fall in a crowded spectral region, and could not be identified. The S (8) transition is found in a region populated by several CO v = 1 – 0 P-branch lines, and cannot be identified either.
Current usage metrics show cumulative count of Article Views (full-text article views including HTML views, PDF and ePub downloads, according to the available data) and Abstracts Views on Vision4Press platform.
Data correspond to usage on the plateform after 2015. The current usage metrics is available 48-96 hours after online publication and is updated daily on week days.
Initial download of the metrics may take a while.