Fig. 4.
Download original image
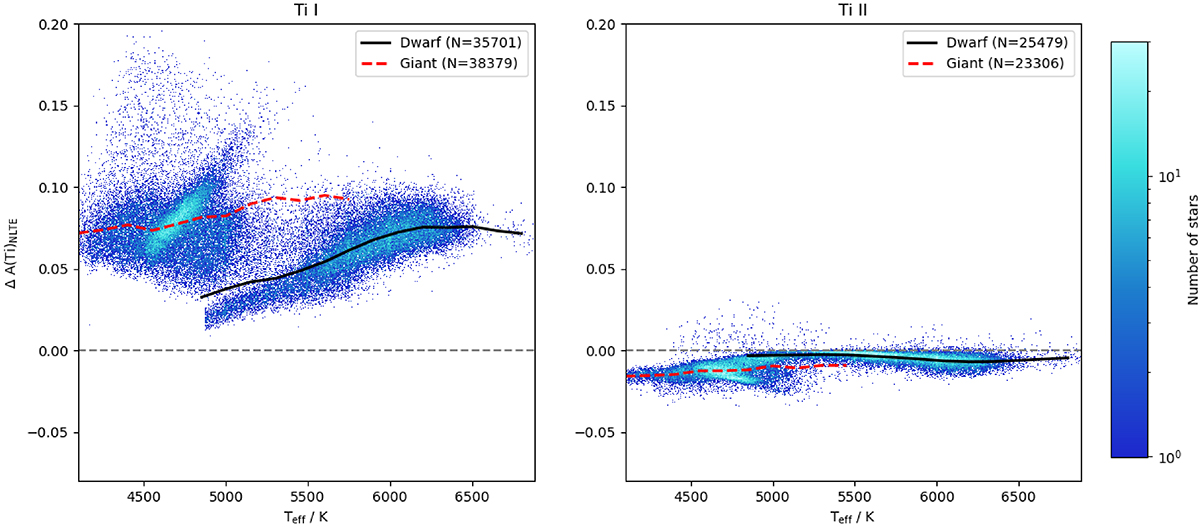
Non-LTE abundance correction for A(Ti)Ti I and A(Ti)Ti II, averaged over lines, as a function of Teff for the GALAH sample. The trends for dwarfs and giants are shown as solid and dashed lines, respectively, using bins of ΔTeff = ±75 K and limited to bins containing at least 30 stars. The colour gradient represents the number of stars per pixel.
Current usage metrics show cumulative count of Article Views (full-text article views including HTML views, PDF and ePub downloads, according to the available data) and Abstracts Views on Vision4Press platform.
Data correspond to usage on the plateform after 2015. The current usage metrics is available 48-96 hours after online publication and is updated daily on week days.
Initial download of the metrics may take a while.