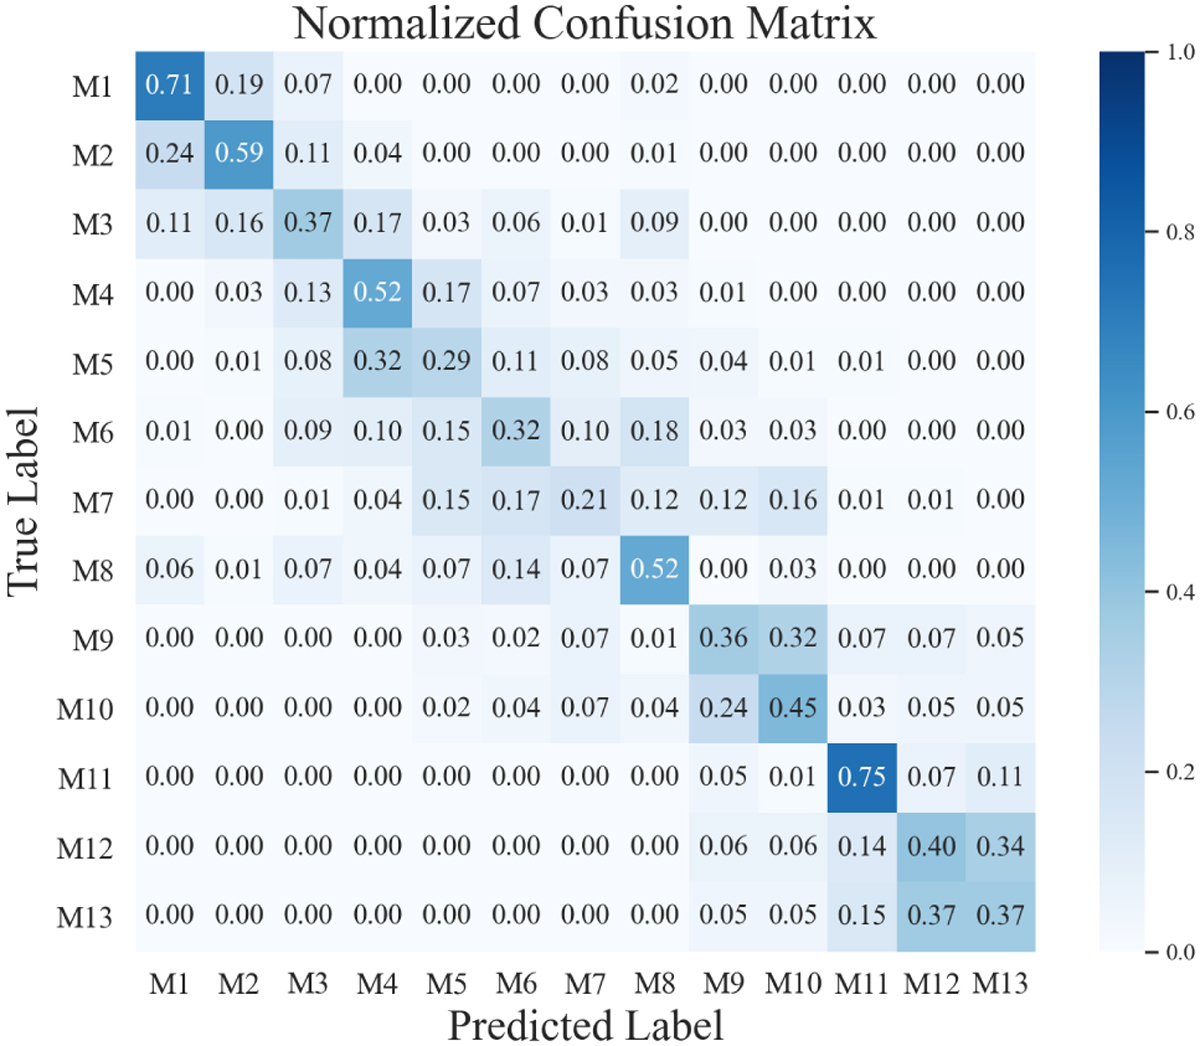
Fig. 6
Download original image
Normalized confusion matrix of mock catalogs for test samples. Each row of this matrix represents a test sample taken from a certain cosmology (containing 700 galaxy clusters), where each cell represents the fraction of galaxy clusters classified as belonging to the x-label cosmology. The diagonal of the matrix represents the recall rate (i.e., the fraction of clusters correctly classified) coinciding with the median recall of each violin in Fig. 5. The non-diagonal elements of the matrix represent the fraction of clusters that have been misclassified to other universes. As it can be seen from Fig. 5 and this figure, ML has a low recall rate and large misclassified fractions for the central models (such as M5, M6, M7, and M9), indicating that these cosmologies have more overlap with neighboring cosmologies.
Current usage metrics show cumulative count of Article Views (full-text article views including HTML views, PDF and ePub downloads, according to the available data) and Abstracts Views on Vision4Press platform.
Data correspond to usage on the plateform after 2015. The current usage metrics is available 48-96 hours after online publication and is updated daily on week days.
Initial download of the metrics may take a while.