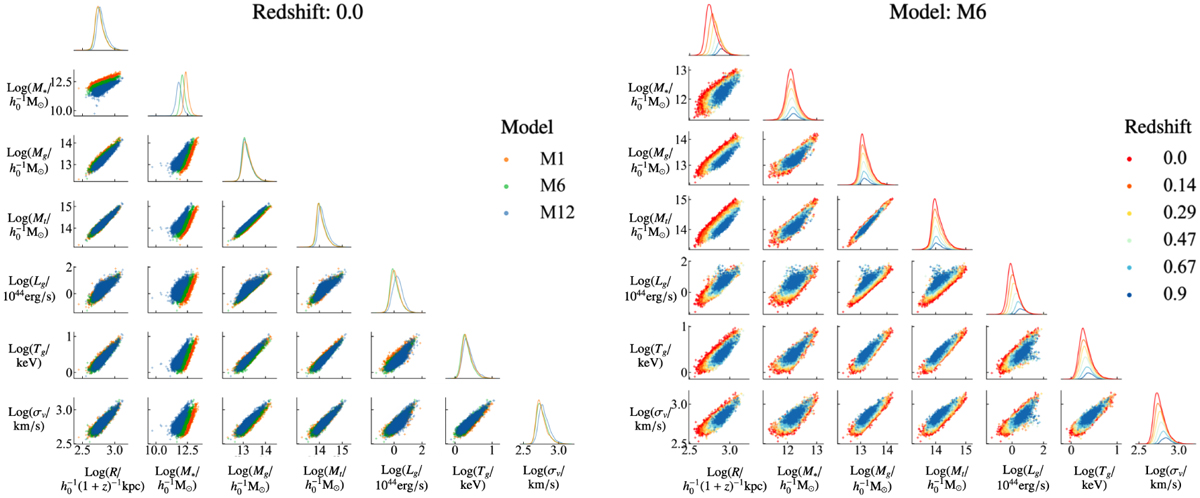
Fig. 3
Download original image
Cluster features with 5% measurement errors. The panels show all possible correlations (i.e., scaling relations) among the seven features for three cosmologies (M1, M6, and M12) at redshift z = 0 (left), and as a function of the redshift (z = 0,0.14,0.29,0.47,0.67,0.9) for M6 (right). Left panel: for a fixed redshift, we use a random sample of 7000 clusters from each cosmology to show how the slope of the scaling relations is affected by cosmology. This is particular clear for the scaling relation related to the stellar mass, M*, and gas mass Mg, while all other scaling relations are more mixed. The corner histogram also shows the normalized distribution of the features in a given cosmological volume. Right panel: for a given cosmological model, apart from the differences in number counts, the galaxy clusters at different redshifts show similar power-law structures but with offsets driven by redshifts. This “cluster feature map” gives an overall impression of scatters and variations of cluster features among different cosmologies, which is the cornerstone of the method that uses galaxy cluster features to predict cosmology based on machine learning. For more details on definitions and accessibility of these cluster features, see Sects. 2.2 and 2.3, respectively.
Current usage metrics show cumulative count of Article Views (full-text article views including HTML views, PDF and ePub downloads, according to the available data) and Abstracts Views on Vision4Press platform.
Data correspond to usage on the plateform after 2015. The current usage metrics is available 48-96 hours after online publication and is updated daily on week days.
Initial download of the metrics may take a while.