Fig. 2
Download original image
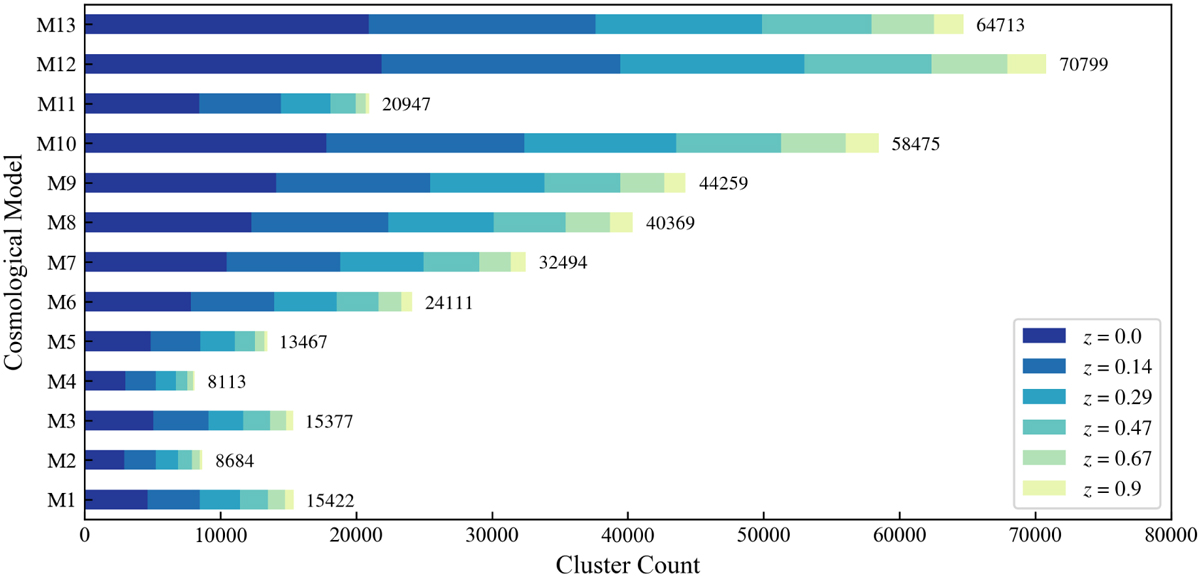
Cluster count in each cosmological model and at each redshift. All of these clusters have already undergone the data preprocessing described in Sect. 2.3. The y-axis lists the different cosmological models, while the cluster counts are displayed in horizontal bars. The different redshifts are represented by different colors, as shown in the legend. As can be seen, the number of galaxy clusters in these 13 models varies significantly, with M12 (70,799) having almost nine times as many clusters as M4 (8,113). To balance the training sample among different cosmologies, we adopt an undersampling, as described in Sect. 3.1.
Current usage metrics show cumulative count of Article Views (full-text article views including HTML views, PDF and ePub downloads, according to the available data) and Abstracts Views on Vision4Press platform.
Data correspond to usage on the plateform after 2015. The current usage metrics is available 48-96 hours after online publication and is updated daily on week days.
Initial download of the metrics may take a while.