Open Access
Fig. 13
Download original image
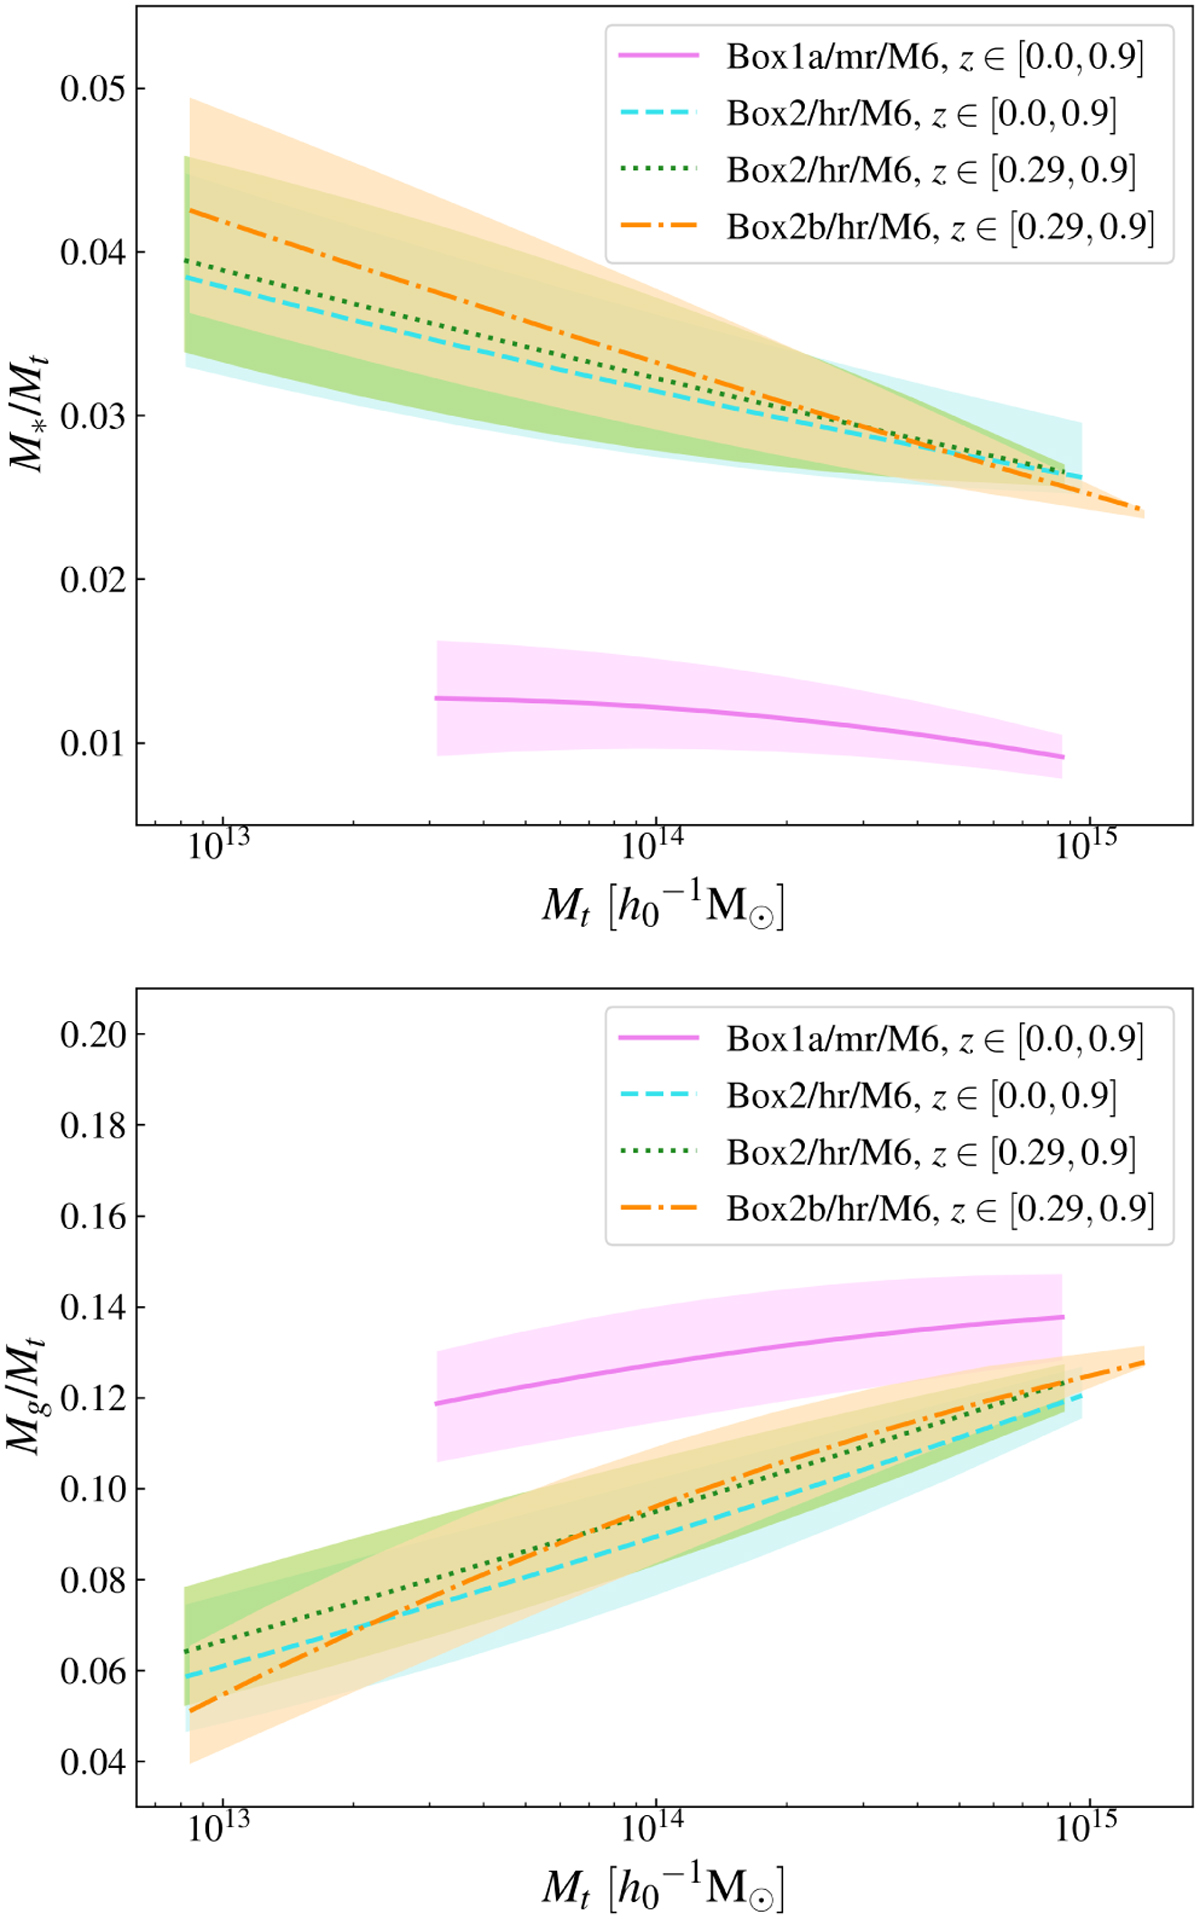
Stellar mass ratio M* /Mt (the upper panel) and gas mass ratio Mg/Mt (the lower panel) as a function of the total mass Mt. Different colors represent different simulation boxes and different redshift intervals. Box1a has a medium-resolution, while Box2 and Box2b have a high-resolution.
Current usage metrics show cumulative count of Article Views (full-text article views including HTML views, PDF and ePub downloads, according to the available data) and Abstracts Views on Vision4Press platform.
Data correspond to usage on the plateform after 2015. The current usage metrics is available 48-96 hours after online publication and is updated daily on week days.
Initial download of the metrics may take a while.