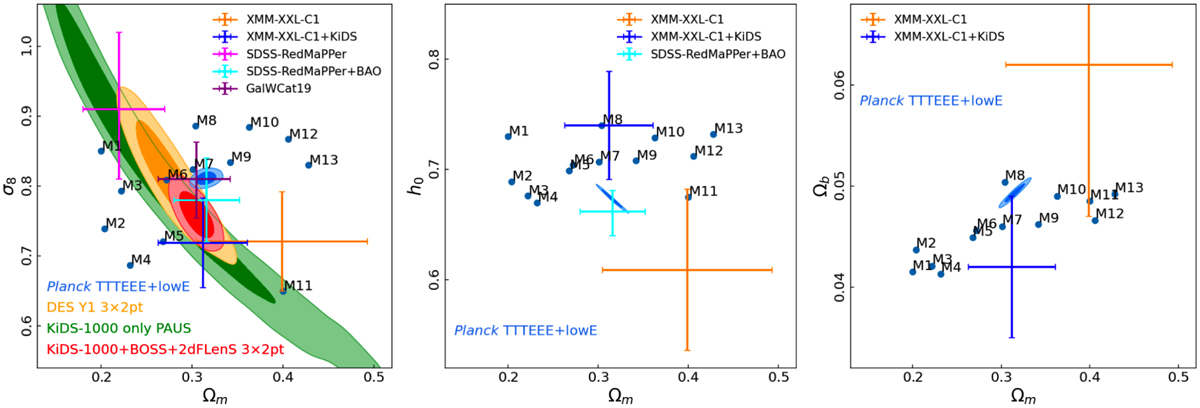
Fig. 1
Download original image
Cosmological parameters’ map for the 13 cosmological models. Blue points show the flat ΛCDM models in the multi-cosmology runs. For comparison, the error bars show the constraints from the XMM-XXL C1 cluster abundance alone (Pacaud et al. 2018) and plus the Kilo-Degree Survey (KiDS) tomographic weak lensing (Hildebrandt et al. 2017) joint analysis, the SDSS RedMaPPer cluster abundance alone and plus BAO joint analysis (Costanzi et al. 2019), the GalWCal19 cluster abundance (Abdullah et al. 2020). Contours show the marginalized posterior distributions of cosmic microwave background (CMB) constraints (Planck Collaboration VI 2020), 3 × 2 pt analysis from the Dark Energy Survey (DES) Y1 (Abbott et al. 2018), 3 × 2 pt analyses from KiDS-1000 with Baryon Oscillation Spectroscopic Survey (BOSS) and the 2-degree Frield Lensing Survey (2dFLenS; Heymans et al. 2021), and KiDS-1000 spec-z fiducial constraints (van den Busch et al. 2022) – see legend bottom left, in each panel.
Current usage metrics show cumulative count of Article Views (full-text article views including HTML views, PDF and ePub downloads, according to the available data) and Abstracts Views on Vision4Press platform.
Data correspond to usage on the plateform after 2015. The current usage metrics is available 48-96 hours after online publication and is updated daily on week days.
Initial download of the metrics may take a while.