Open Access
Fig. 2.
Download original image
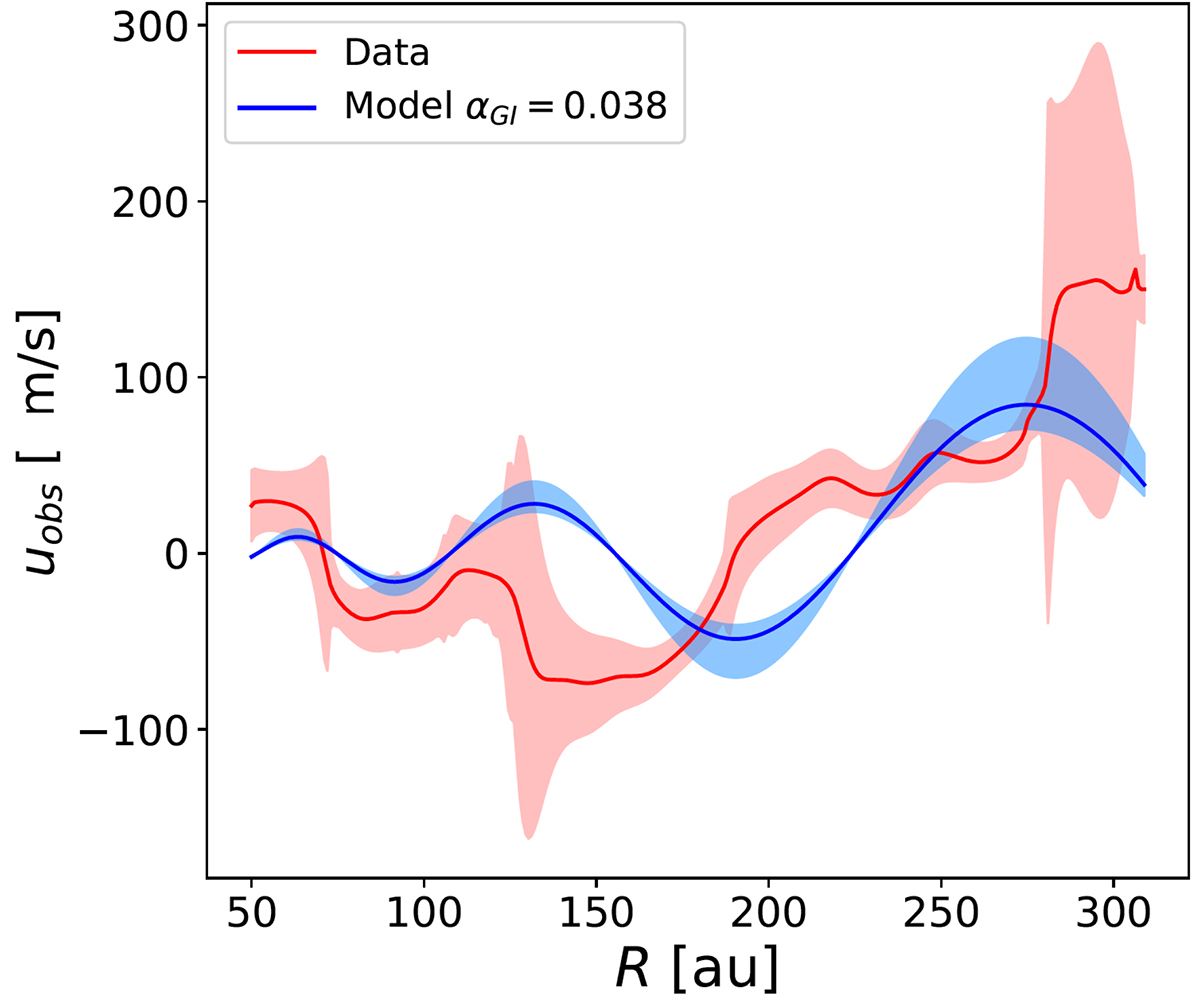
GI wiggle in the PV space: comparison between the data (red line) and the model (blue line). The shaded region represents the error on the model, driven by the uncertainties on the star and disc masses from Veronesi et al. (2021).
Current usage metrics show cumulative count of Article Views (full-text article views including HTML views, PDF and ePub downloads, according to the available data) and Abstracts Views on Vision4Press platform.
Data correspond to usage on the plateform after 2015. The current usage metrics is available 48-96 hours after online publication and is updated daily on week days.
Initial download of the metrics may take a while.