Fig. 1.
Download original image
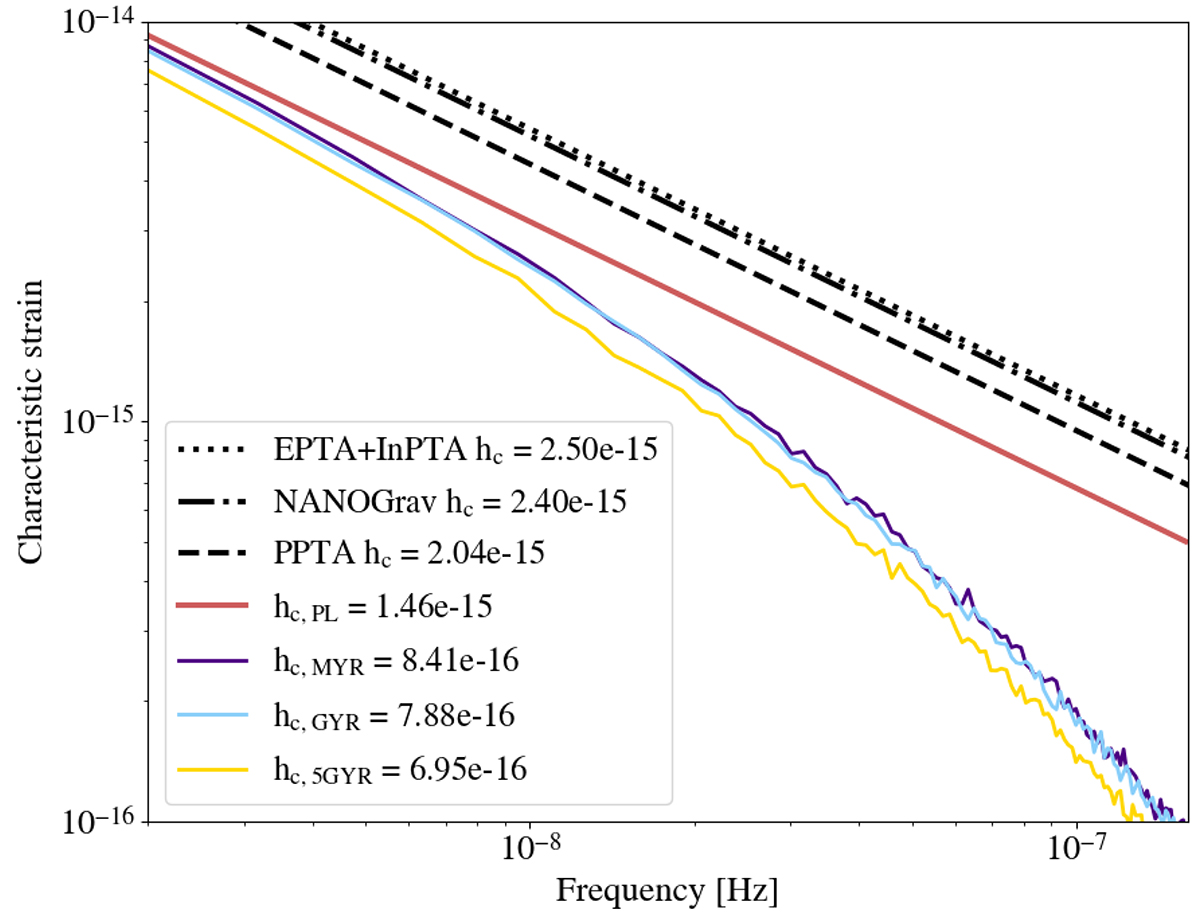
Characteristic strain of the GWB for the default model B4H10. Black lines show the amplitude of the signal constrained by the PTA experiments, while solid colored lines show median amplitudes for 100 Myr, 1 Gyr, and 5 Gyr scenarios.
Current usage metrics show cumulative count of Article Views (full-text article views including HTML views, PDF and ePub downloads, according to the available data) and Abstracts Views on Vision4Press platform.
Data correspond to usage on the plateform after 2015. The current usage metrics is available 48-96 hours after online publication and is updated daily on week days.
Initial download of the metrics may take a while.