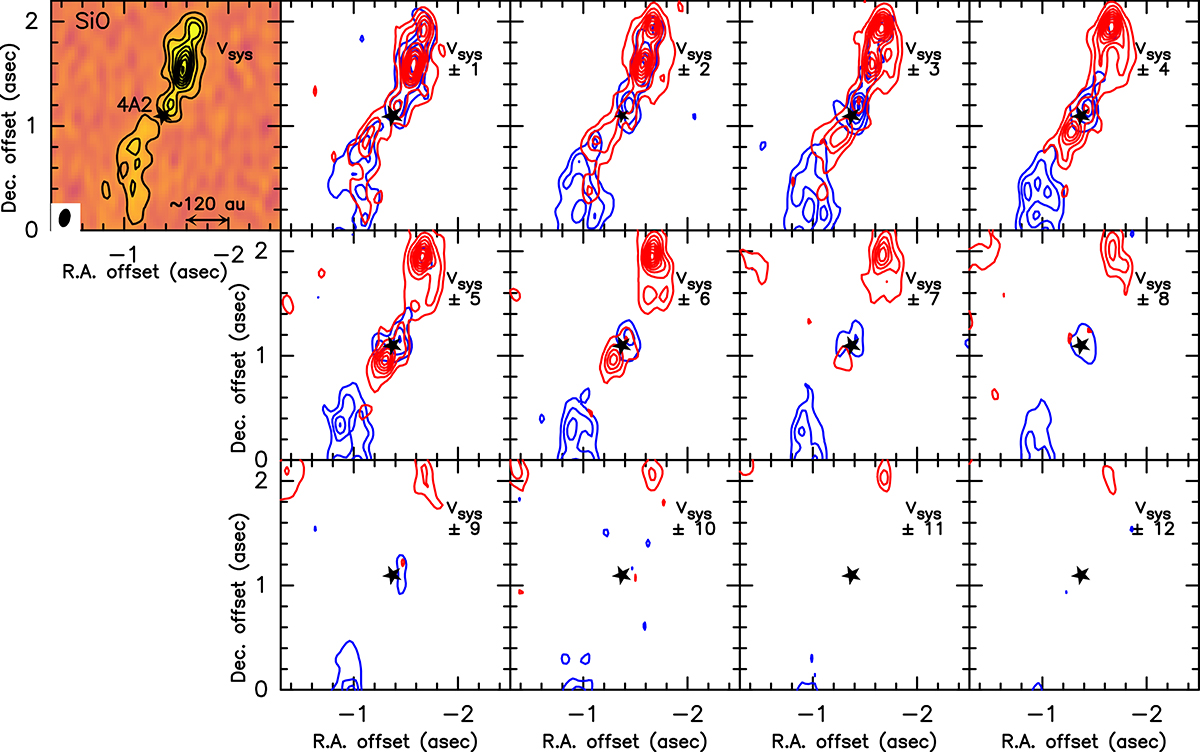
Fig. B.1.
Download original image
ALMA FAUST SiO velocity channel maps. Each panel corresponds to a 1 km s−1 increment from the systemic velocity (vsys = 6.8 km s−1; Choi 2001). The black star marks the position of the IRAS 4A2 protostar. The SiO beam is reported in the lower left corner of the vsys panel (shown in colour scale). First contours and steps are 3σ (σ = 1 mJy beam−1).
Current usage metrics show cumulative count of Article Views (full-text article views including HTML views, PDF and ePub downloads, according to the available data) and Abstracts Views on Vision4Press platform.
Data correspond to usage on the plateform after 2015. The current usage metrics is available 48-96 hours after online publication and is updated daily on week days.
Initial download of the metrics may take a while.