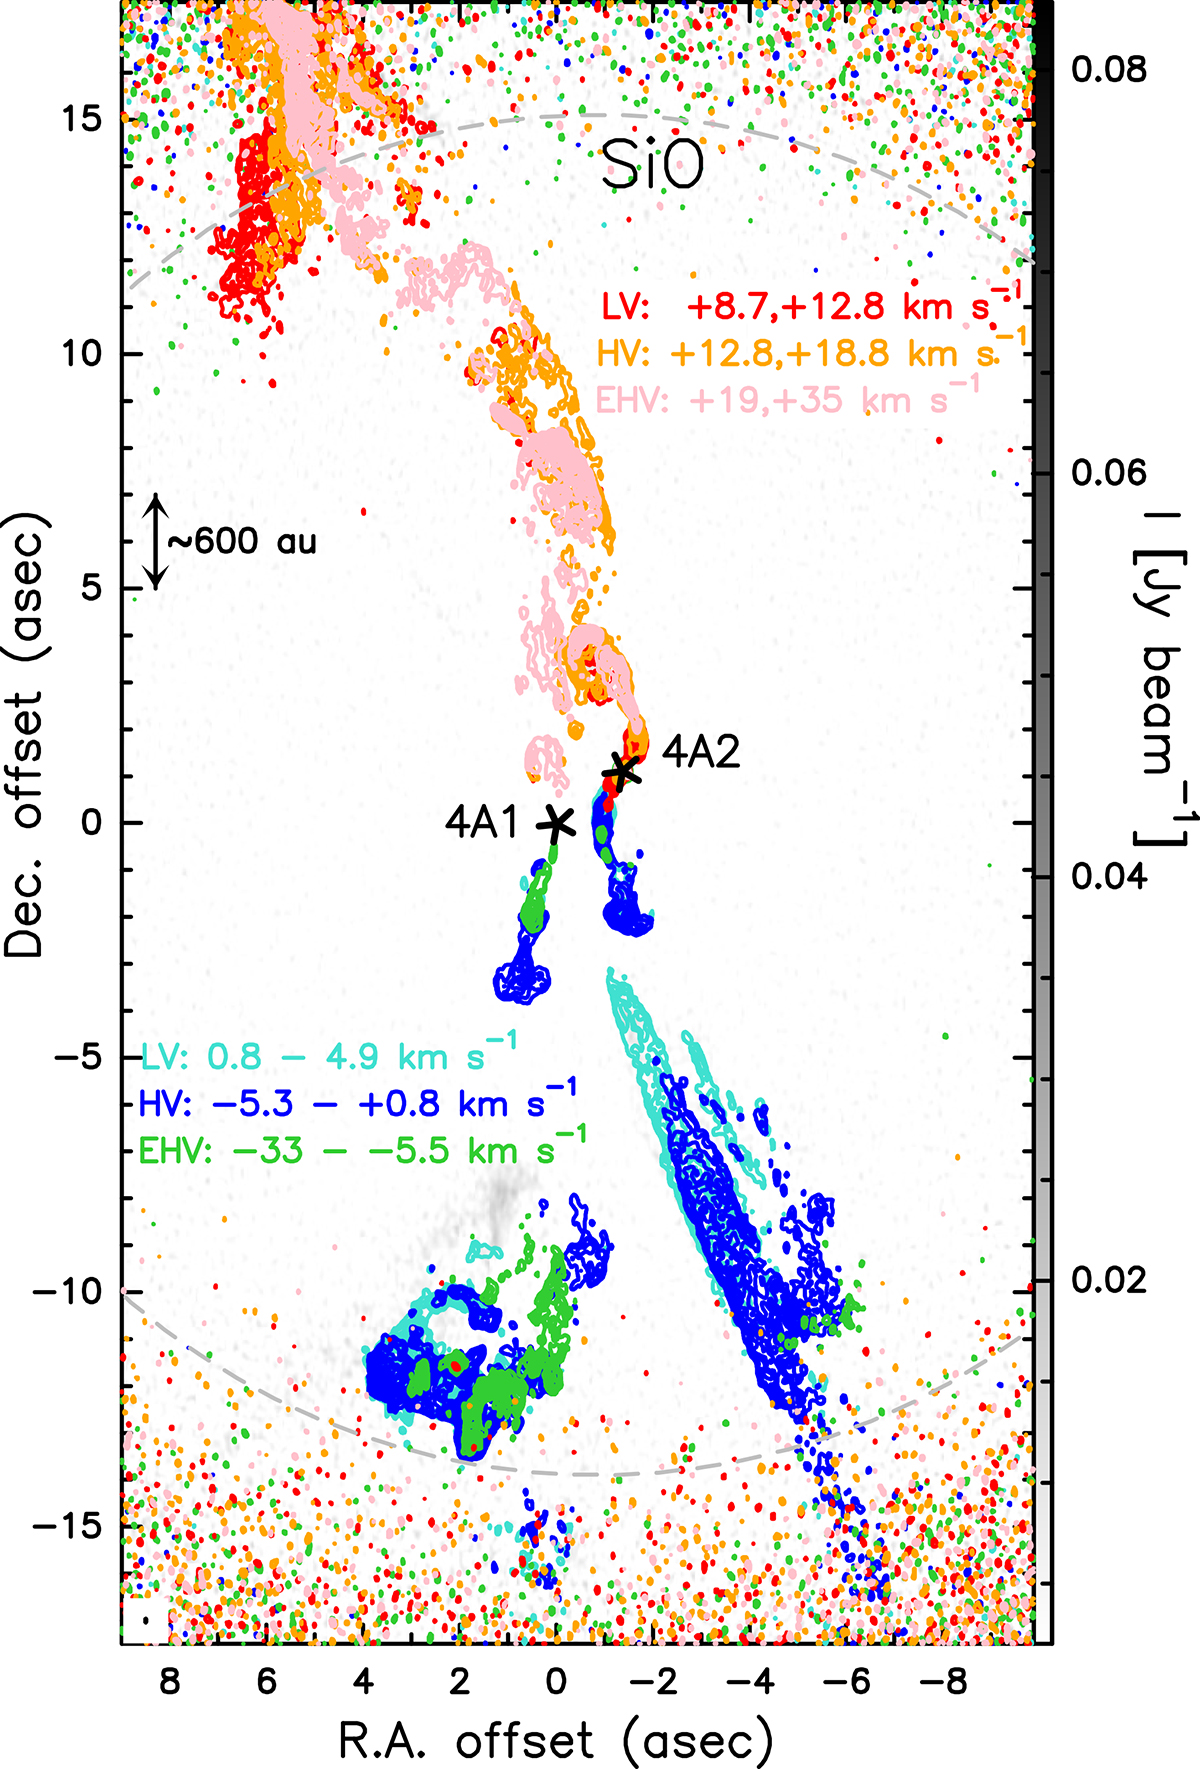
Fig. A.1.
Download original image
Large-scale view of the ALMA FAUST SiO emission. Each velocity range corresponds to a specific colour, and is shown in contours starting at 4σ with steps of 2σ, where σ= 3, 3.5, and 6 mJy beam−1 km s−1 for the LV (low-velocity: red and cyan), HV (high-velocity: orange and blue), EHV (extremely high-velocity: pink and green) range, respectively. In background, in grey scale, a range around the vsys is shown (4.9–8.5 km s−1). The synthesised beam is depicted in the lower left corner, and the primary beam is shown as a dashed grey circle.
Current usage metrics show cumulative count of Article Views (full-text article views including HTML views, PDF and ePub downloads, according to the available data) and Abstracts Views on Vision4Press platform.
Data correspond to usage on the plateform after 2015. The current usage metrics is available 48-96 hours after online publication and is updated daily on week days.
Initial download of the metrics may take a while.