Fig. 3.
Download original image
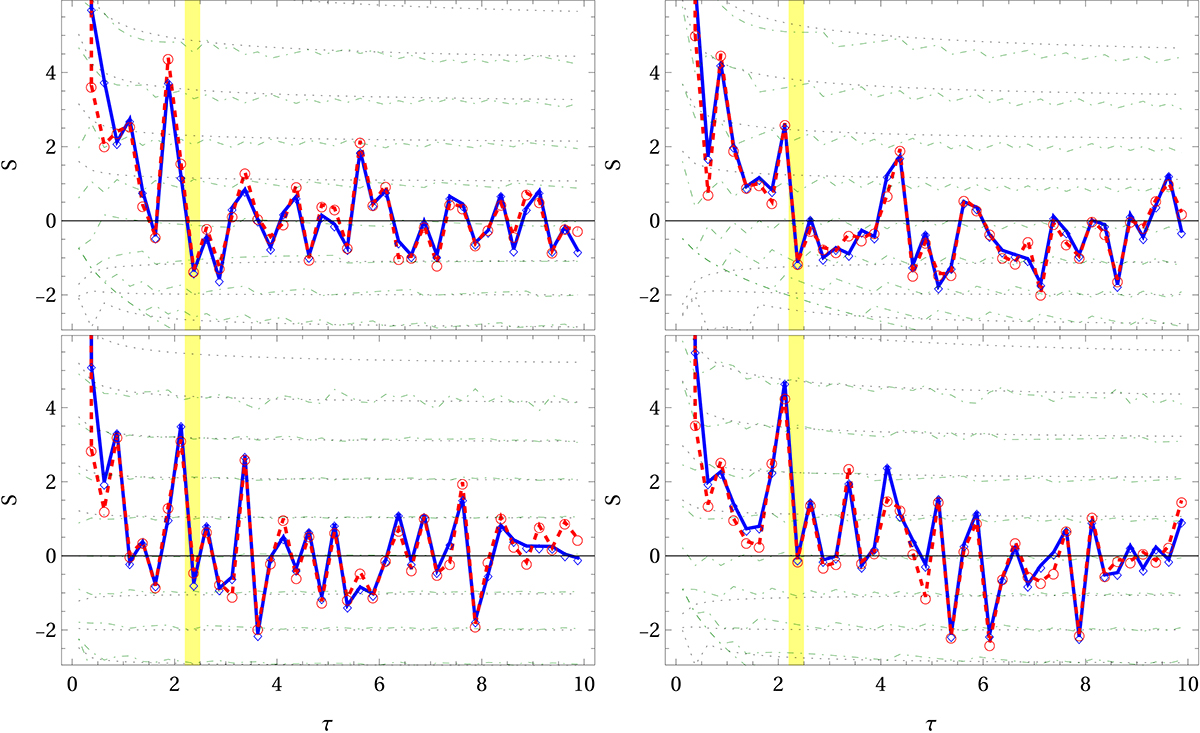
Top row: significance, S(τ), radial profiles of all (left panel) or only bright F > Fth (right) extended eROSITA sources, SW (blue diamonds, with solid lines to guide the eye) or CW (red circles, with dashed lines) stacked around massive clusters (bins 2–4). Also shown are the Poisson-statistics confidence levels (±{1σ, 2σ, 3σ, …}; dotted black curves), the control-sample median and the corresponding containment fractions (50%,16%,2.3%,… for SW; dot-dashed green lines), and the anticipated 2.2 < τ < 2.5 VS region (vertical yellow shading) based on previous stacked γ-ray (RK18) and radio (H23) continuum and discrete X-ray and radio source detections (I24). Bottom row: same as the top panels, but also including non-extended sources in the same Fmin < F < Fmax range.
Current usage metrics show cumulative count of Article Views (full-text article views including HTML views, PDF and ePub downloads, according to the available data) and Abstracts Views on Vision4Press platform.
Data correspond to usage on the plateform after 2015. The current usage metrics is available 48-96 hours after online publication and is updated daily on week days.
Initial download of the metrics may take a while.