Open Access
Fig. 2.
Download original image
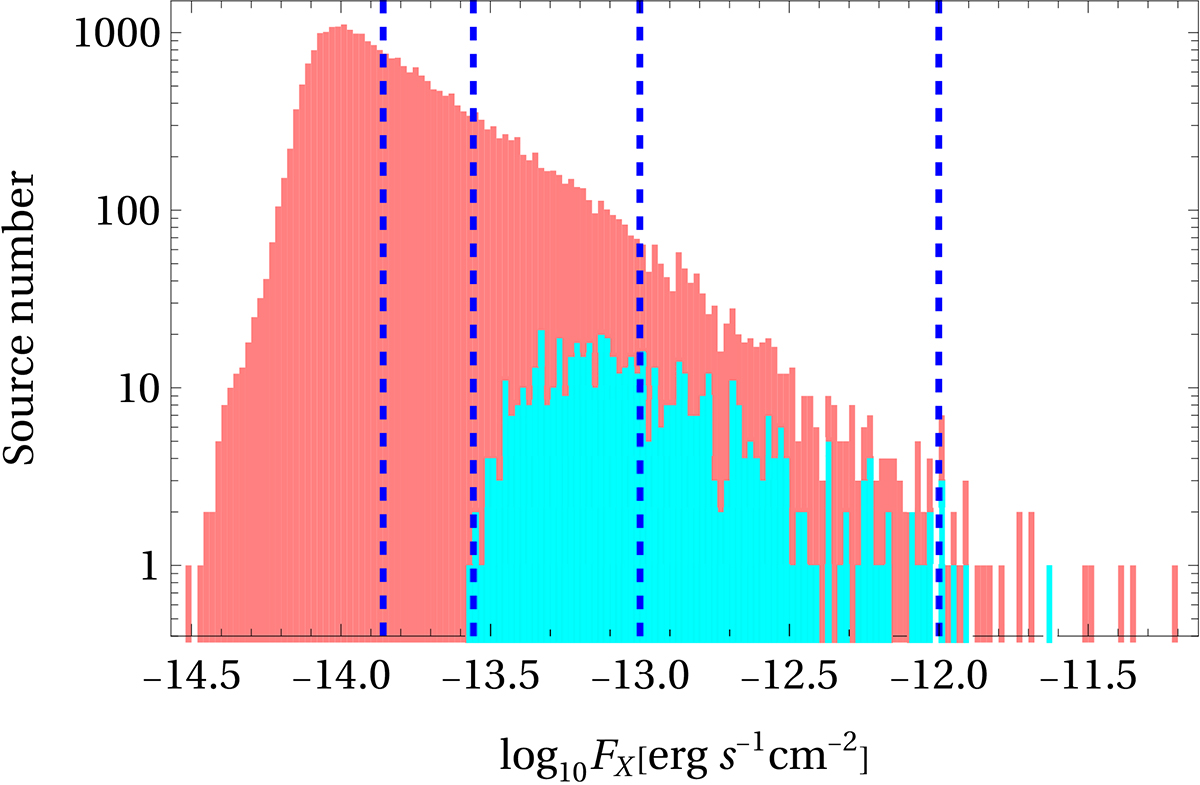
Nominal ([0.2, 2.3] keV) flux distributions of extended (lower, cyan histogram) and all (higher, pink histogram) EDR catalog sources, with vertical dashed lines showing (from left to right) the flux levels of the full-catalog median, the mean (Fmean ≃ Fmin), the threshold (Fth), and the upper cutoff (Fmax).
Current usage metrics show cumulative count of Article Views (full-text article views including HTML views, PDF and ePub downloads, according to the available data) and Abstracts Views on Vision4Press platform.
Data correspond to usage on the plateform after 2015. The current usage metrics is available 48-96 hours after online publication and is updated daily on week days.
Initial download of the metrics may take a while.